Copernicus Climate Change
Service
Climate-KIC

What is Copernicus
- Copernicus is an EU programme aimed at developing European information services based on satellite Earth Observation and in-situ (non-space) data.
- Copernicus is implemented by the European Commission (EC) with the support from the European Space Agency (ESA) for the Space component and the European Environment Agency (EEA) for the in-situ component
The objective of Copernicus
- To monitor and forecast the state of the environment on land, sea and in the atmosphere, in order to support climate change mitigation and adaptation strategies, the efficient management of emergency situations and the improvement of the security of every citizen
https://emergency.copernicus.eu/mapping/ems/what-copernicus - It combines satellite observation data with data from sensor networks on the Earth’s surface to build a comprehensive picture of our planet and its environment
https://www.eea.europa.eu/about-us/who/copernicus-1
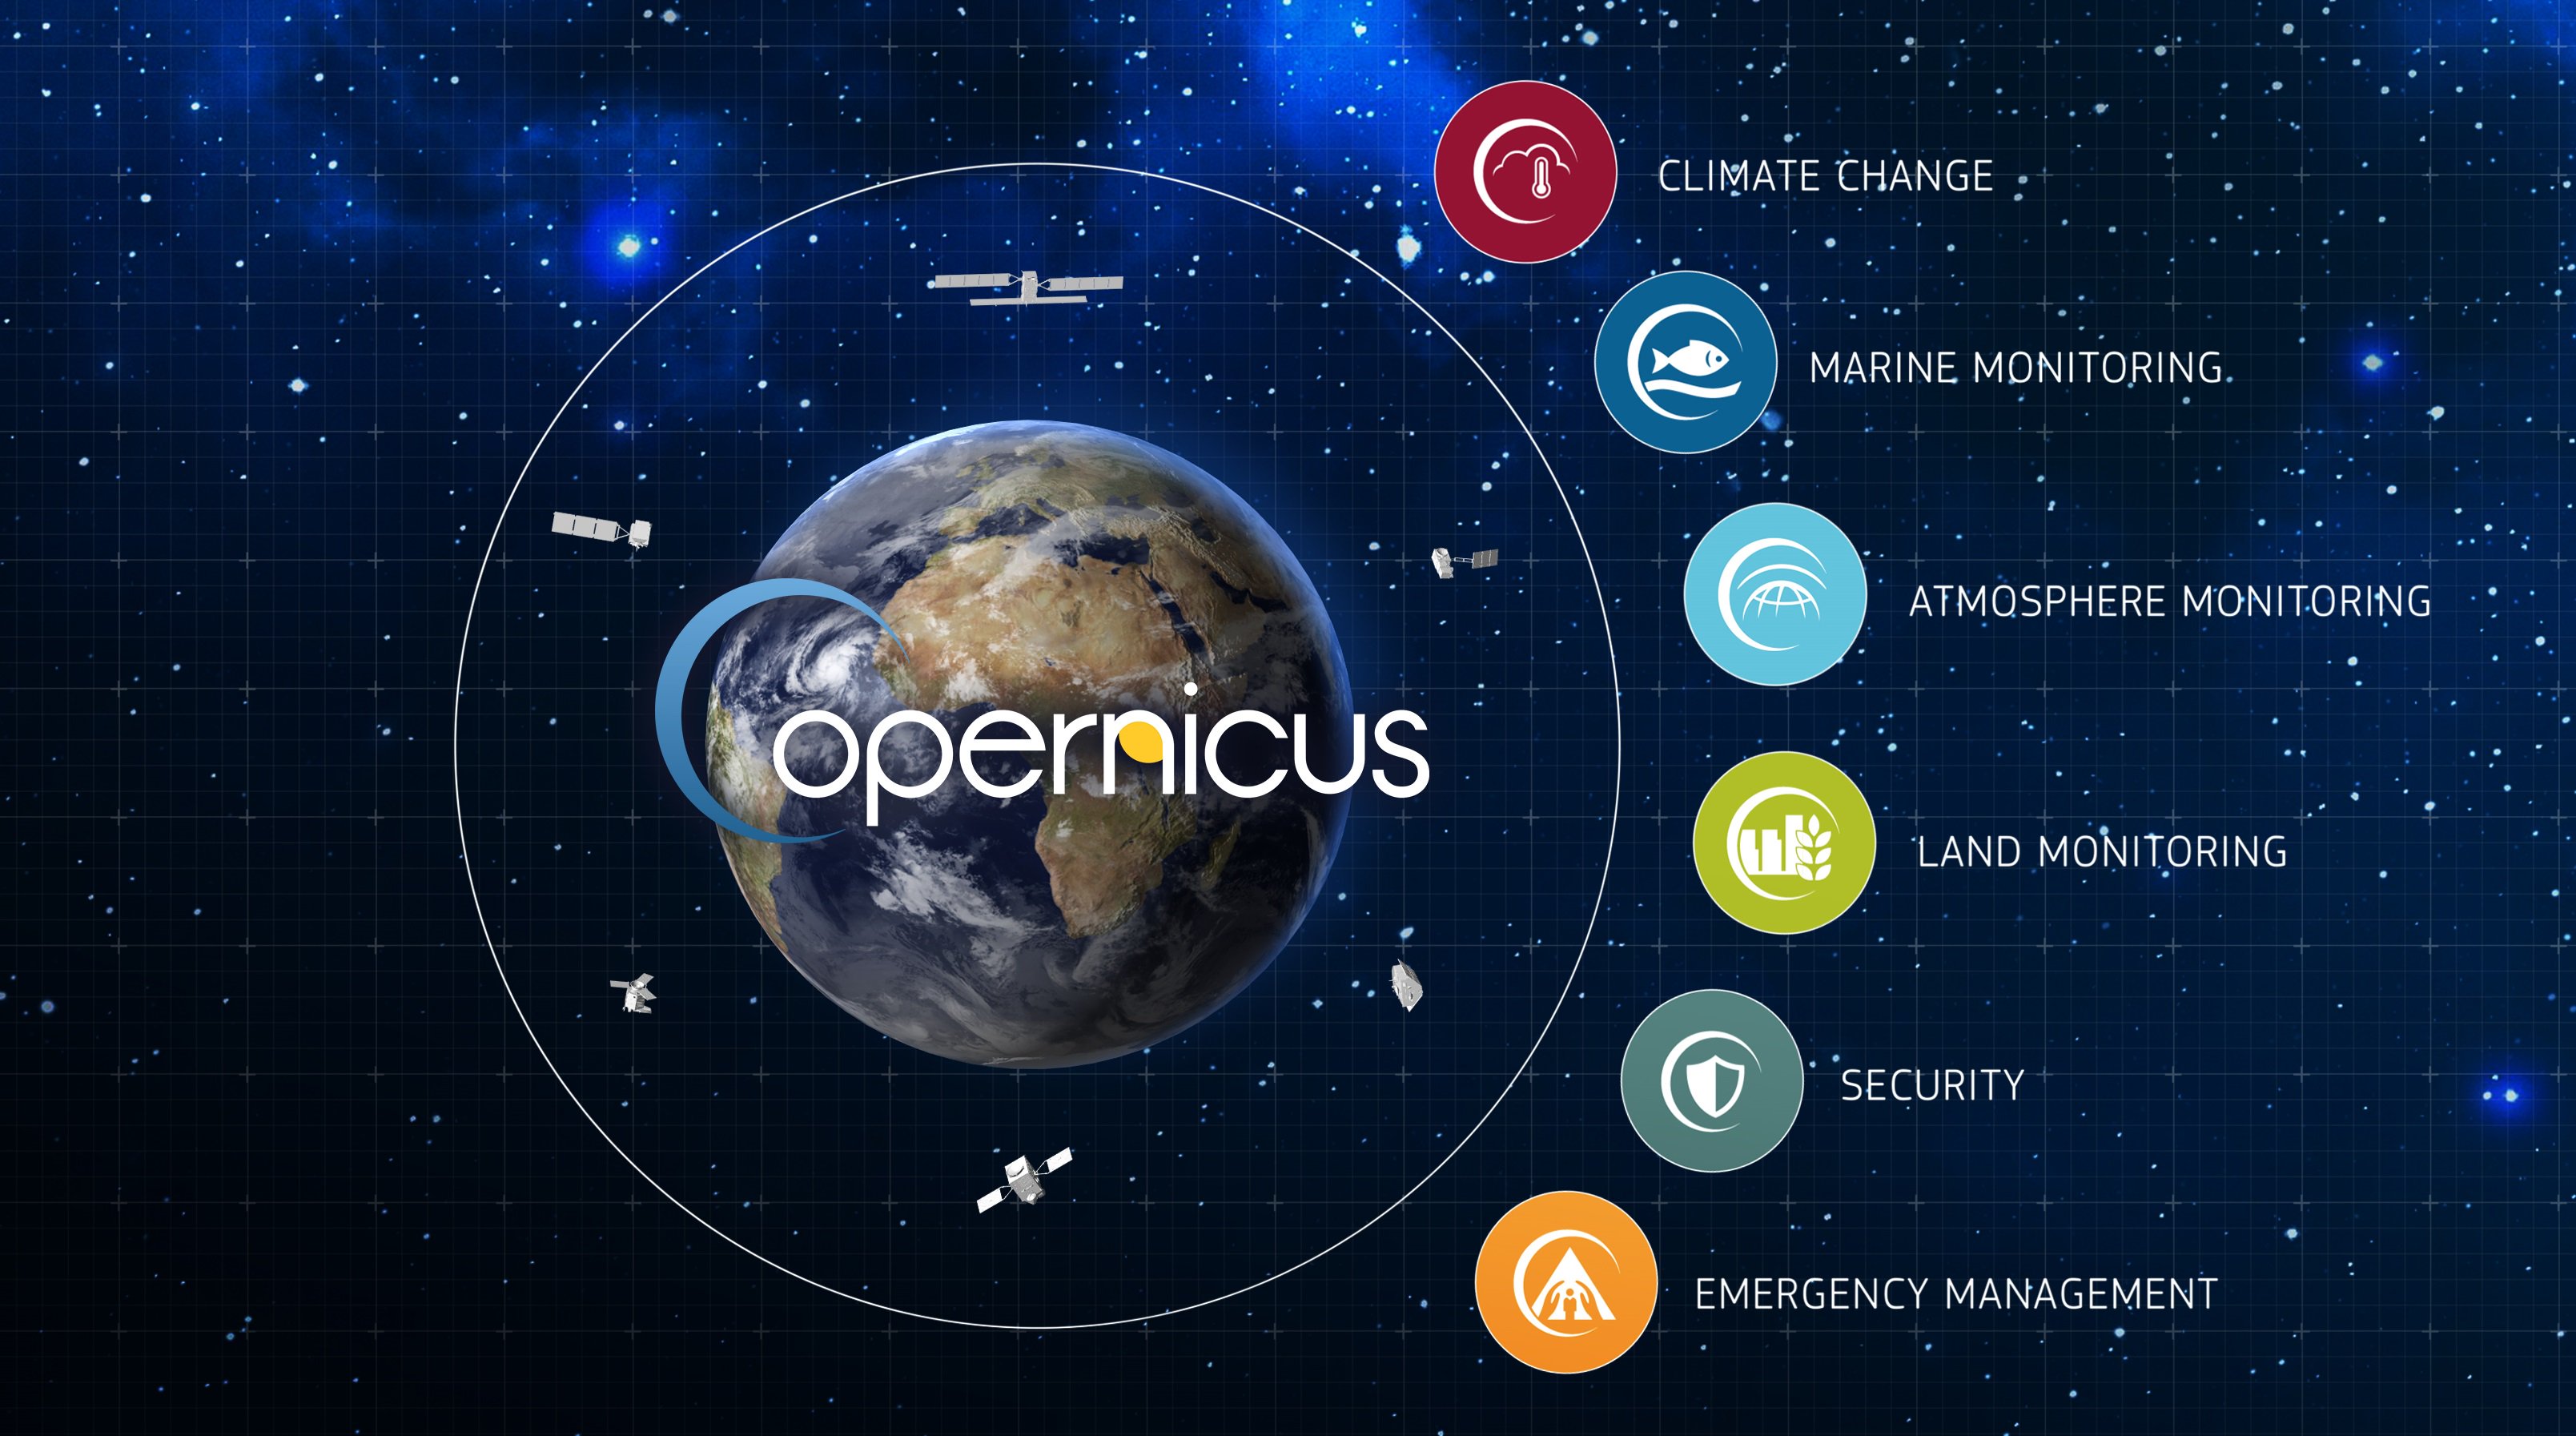
The Components of Copernicus
- Three components make up Copernicus: Space, Services and In Situ.
- The Services Component is made up of six thematic areas: land, marine, atmosphere, climate change, emergency management and security.
https://www.eea.europa.eu/about-us/who/copernicus-1
Copernicus Climate Change Service (C3S)
The Copernicus Climate Change Service (C3S) supports society by providing authoritative information about the past, present and future climate in Europe and the rest of the World.
The C3S mission is to support adaptation and mitigation policies of the European Union by providing consistent and authoritative information about climate change. We offer free and open access to climate data and tools based on the best available science. We listen to our users and endeavour to help them meet their goals in dealing with the impacts of climate change.
Copernicus Climate Change Service (C3S)
C3S is one of six thematic information services provided by the Copernicus Earth Observation Programme of the European Union. Copernicus is an operational programme building on existing research infrastructures and knowledge available in Europe and elsewhere.
C3S relies on climate research carried out within the World Climate Research Programme (WCRP) and responds to user requirements defined by the Global Climate Observing System (GCOS). C3S provides an important resource to the Global Framework for Climate Services (GFCS).
Climate datasets
C3S ensures that users can access the best available climate data free of charge and without restrictions.

https://climate.copernicus.eu/climate-datasets
Observations
Observations are key to understanding the climate system. C3S users can access a wide variety of instrumental data records, ranging from historic weather observations to the latest measurements from space.
- The global Climate Observing System (GCOS)
- ECV Products
- Quality-controlled observations
- Data rescue
Climate datasets
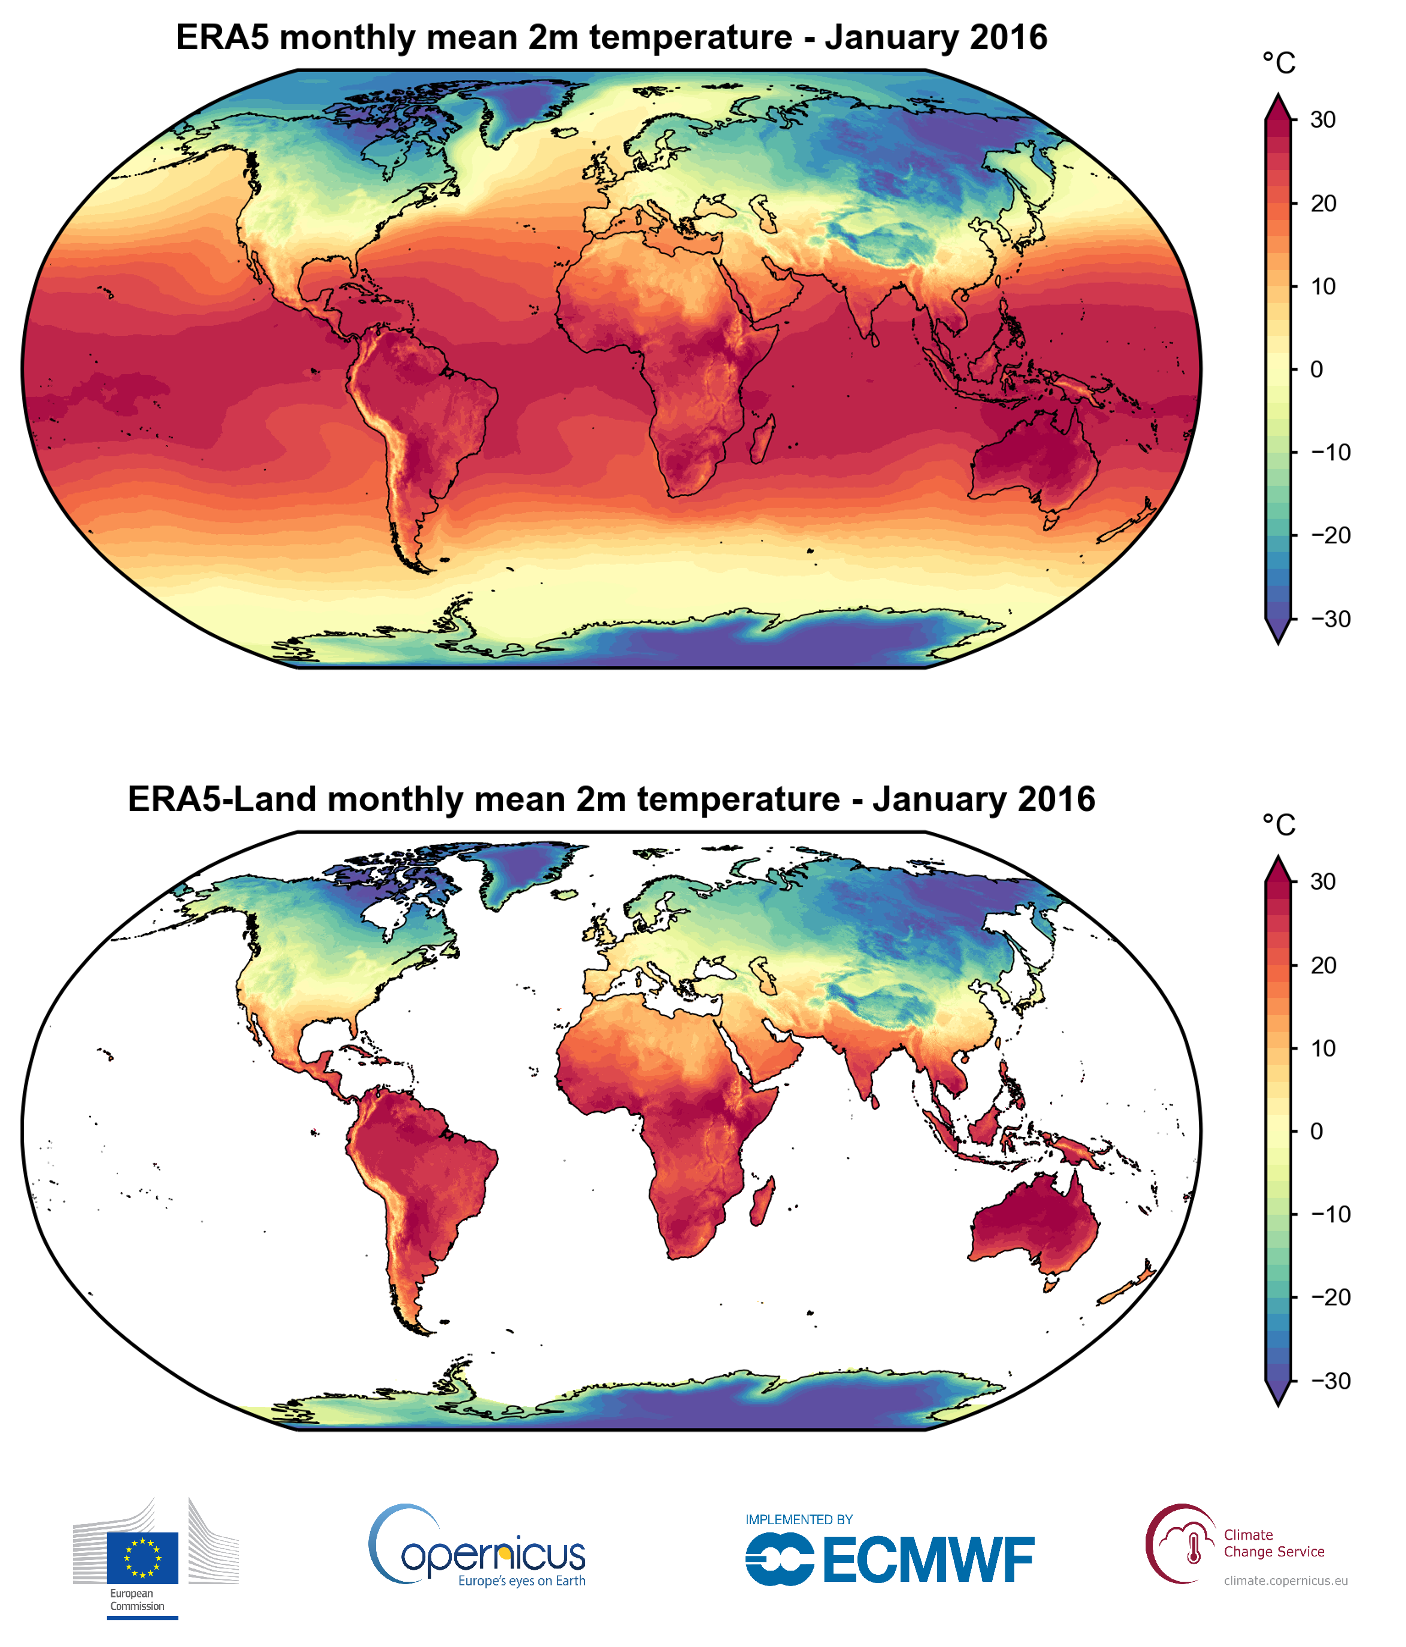
Climate reanalyses combine past observations with models to generate consistent time series of multiple climate variables. Reanalyses are among the most-used datasets in the geophysical sciences. They provide a comprehensive description of the observed climate as it has evolved during recent decades, on 3D grids at sub-daily intervals.
Climate datasets
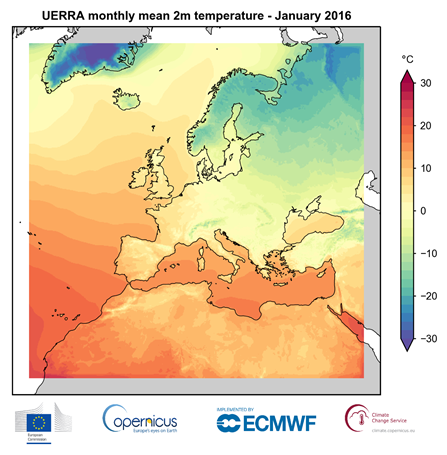
Regional reanalysis data for the European domain are provided to C3S by the Swedish Meteorological and Hydrological Institute (SMHI). Initially based on developments in the FP7 UERRA project, reanalysis data from 1961 to 2019 at 11 km horizontal resolution are available in the Climate Data Store. A new regional reanalysis system for Europe is currently being developed that will provide improved data at 5.5 km resolution by mid 2021.
Seasonal forecasts
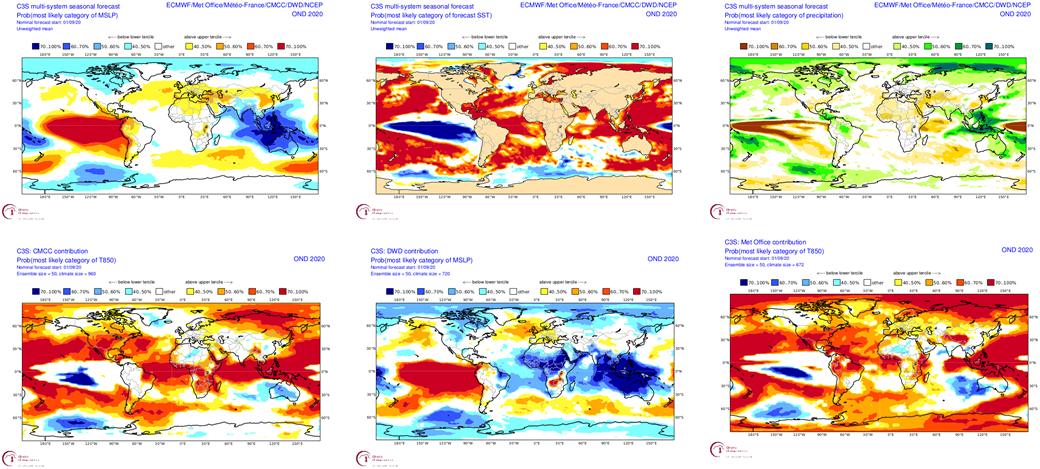
The C3S regularly publishes seasonal forecast products. These products are based on data from several state-of-the-art seasonal prediction systems.
The seasonal forecasts include data as well as graphical products and are updated every month – currently on the 13th day at 12 UTC. They cover a time period of six months.
The graphical products consist of maps or time series for a number of forecast variables (air and sea-surface temperature, atmospheric circulation and precipitation); the interface offers the facility to navigate the full set of graphics. Multi-system combinations, as well as predictions from the individual component systems, are available.
Seasonal forecasts
Prediction systems
The centres currently providing forecasts to C3S are ECMWF, The Met Office, Météo-France, the German Weather Service (Deutscher Wetterdienst, DWD), the Euro-Mediterranean Center on Climate Change (Centro Euro-Mediterraneo sui Cambiamenti Climatici, CMCC) and the US National Weather Service's NCEP (National Centers for Environmental Prediction, NCEP).
Climate projections
Climate projections are simulations of Earth’s climate in future decades (typically until 2100) based on assumed ‘scenarios’ for the concentrations of greenhouse gases, aerosols, and other atmospheric constituents that affect the planet’s radiative balance.
Climate projections are obtained by running numerical models of Earth’s climate, which may cover either the entire globe or a specific region e.g. Europe. These models are referred to as Global Climate Models (GCMs) – also known as General Circulation Models – or Regional Climate Models (RCMs), respectively.
In setting priorities for making projection results available, C3S has put a strong focus on providing quantitative information about the uncertainties in projected outcomes, taking into account various sources. Such uncertainties arise from differences in emission scenarios, differences among the formulations of numerical models, and the natural variability of the climate system on decadal scales.
Climate projections
Climate Data Store
Most of the latest climate projections performed by GCMs have been part of the Coupled Model Intercomparison Project – phase 5 (CMIP5).
Simulations and projections by RCMs have followed the protocols set by the Coordinated Regional Climate Downscaling Experiment (CORDEX).
The C3S Climate Data Store (CDS) will provide access to a significant part of the global projections run under CMIP5 and to the CORDEX regional projections covering European domains.
Climate projections
The Climate Data Store
One of the current C3S activities is focused on developing tools and infrastructure to access these projections from nodes of the Earth System Grid Federation (ESGF), through the interface of the C3S CDS. Projections available through the CDS will be accompanied by historical simulations that cover the 20th century and the first decade of the 21st century, to allow users to estimate the fidelity of simulations against observational data.
Tools for using climate data
Through the Climate Data Store, C3S provides a suite of software tools to allow scientists and consultants to make use of climate datasets to support planning and decision-making.
The Toolbox can be used by developers to create web-based applications that draw on the datasets available in the CDS. These applications can then be made available to users. Users are given some control over the applications by interacting with web form elements. This could involve the selection of a range of dates or a geographical area of interest, which is then used to parameterise the application.
Tools for using climate data
All computations are executed within the CDS infrastructure. The data used by the applications do not leave the CDS, and only the results are made available to the users. These results typically take the form of tables, maps and graphs on the CDS data portal. Users may be offered the ability to download these results.
The variety of data types, formats and structures makes their combined use highly challenging. The aim of the Toolbox is to provide a set of high-level utilities that allow developers to implement applications without the need to know about these differences.
C3S seasonal charts
 https://climate.copernicus.eu/seasonal-forecasts
Quality assurance
Our quality assurance projects aim to evaluate and foster the development of our climate services. They assess the technical and scientific quality of the service, including its value to users.
Effective evaluation and quality control will ensure C3S represents the latest developments in climate science, and that innovative service elements are introduced, reflecting current research. C3S contracts expert organisations from across Europe to carry out its evaluation and quality control by issuing regular tenders.
Quality assurance
- SECTEUR - Sector Engagement for the Copernicus Climate Change Service: Translating European User Requirements
- QA4Seas - Quality Assessment Strategies for Multi-model Seasonal Forecasts
- DECM- Data Evaluation for Climate Models
- EQCO - Evaluation and Quality Control for Observations
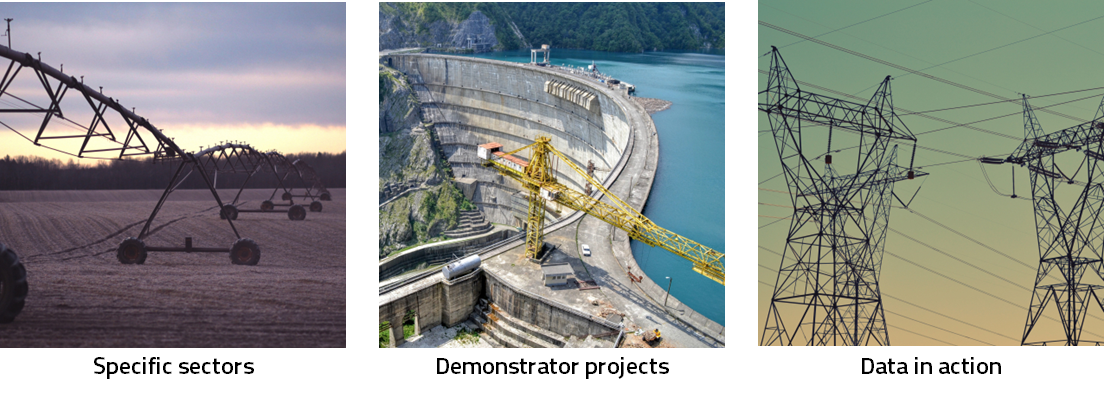
Sectoral impacts
We aim to provide data, tools and information to support public and private sectors in their climate-sensitive decisions. Working with key climate-sensitive sectors we have developed a number of applications that demonstrate how climate data can be accessed, transformed and made relevant to address specific contexts.
These applications are created through the Climate Data Store and presented through our demonstrator pages to show how the data can be used in practice. Our case studies exemplify how a range of businesses already use our data to make informed decisions and operate in a more sustainable way.
https://climate.copernicus.eu/sectoral-impactsSectoral impacts
 https://climate.copernicus.eu/sectoral-impacts
Sectoral impacts
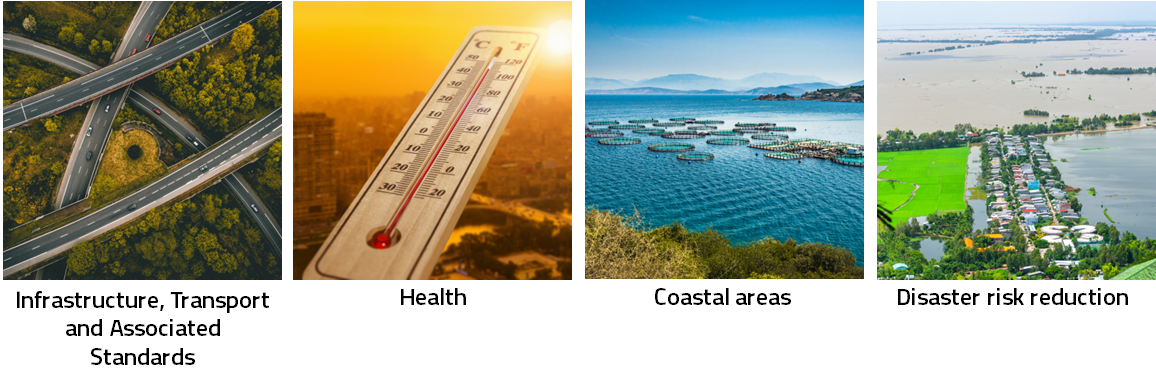
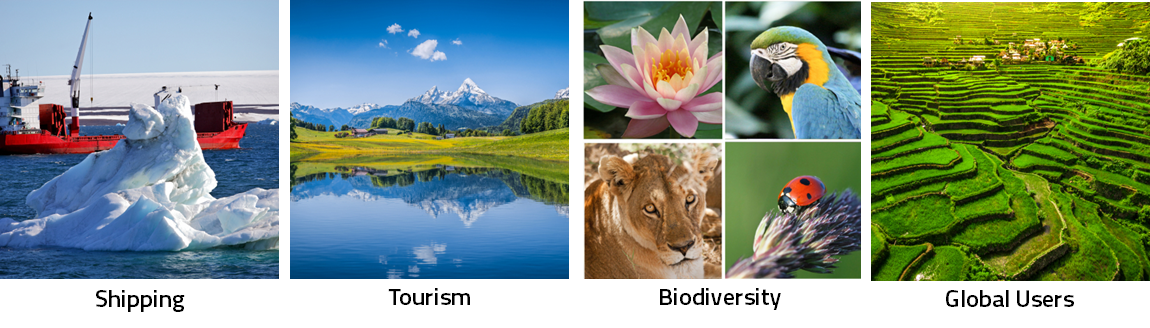
Sectoral specific challenges
We provide data, tools and information that can help the private and public sectors deal with climate-related decision-making and planning.
Working across sectors, we have developed user-driven applications that make climate data accessible and relevant to their needs. A range of organisations already use our data to make informed decisions.
https://climate.copernicus.eu/sectoral-specific-challengesSectoral impacts
Sectoral specific challenges
 https://climate.copernicus.eu/sectoral-specific-challenges
Sectoral impacts
Sectoral specific challenges
 https://climate.copernicus.eu/sectoral-specific-challenges
Sectoral impacts
Sectoral specific challenges
 https://climate.copernicus.eu/sectoral-specific-challenges
Demonstration projects
Global Agriculture project
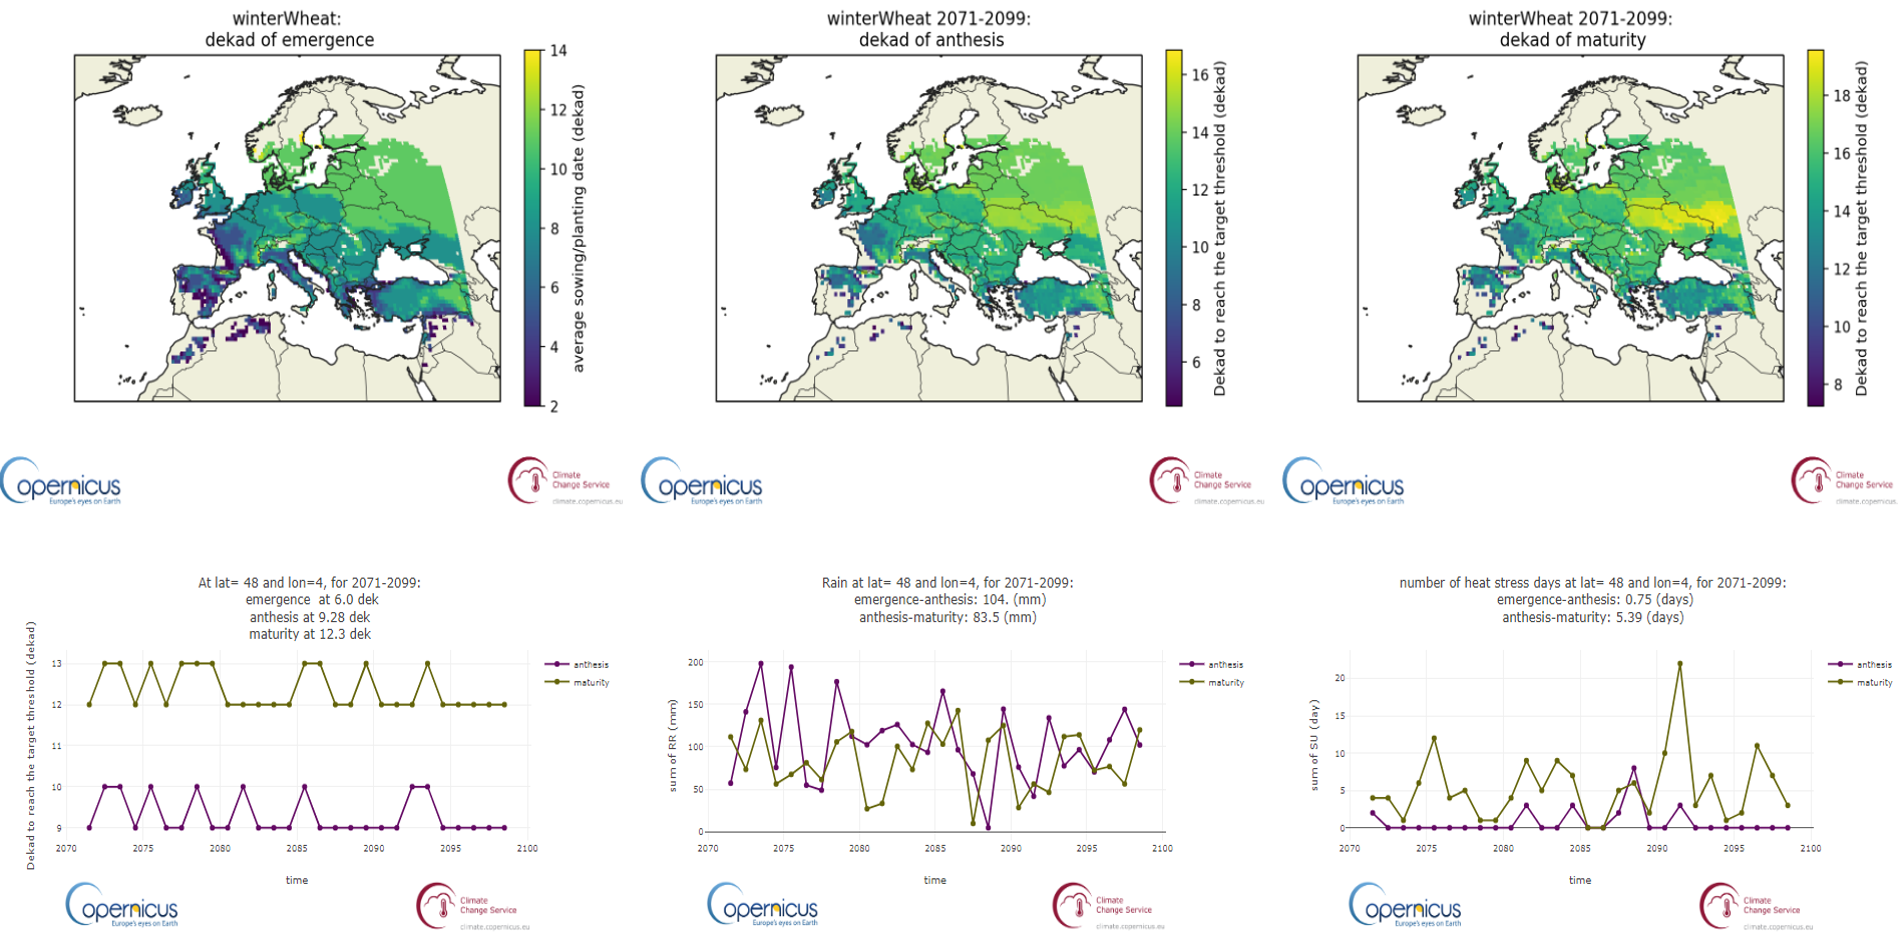
For agriculture and food-related management, especially at larger spatial scales, relatively simple, solely climate-dependent indicators often suffice to support informed decision making. Conventional climate indicators are generally calculated in terms of calendar months or meteorological seasons (December–February, March–May, June–August, September–November).
The climate indicators we provide are relevant for the actual growing season of the crop of interest, which may vary substantially around the globe. Therefore, we augment our data service by providing aggregation routines to current global crop calendars and growing areas. Furthermore, some climate indicators we provide are be adjustable to crop-specific thresholds. Thus, optimal and stressed climatic conditions can be identified for historic, current and coming growing seasons, as well as for future climate conditions, allowing their impact on the development of, and suitability for, specific crops to be assessed.
https://climate.copernicus.eu/global-agriculture-projectDemonstration projects
Global Agriculture project
 https://climate.copernicus.eu/global-agriculture-project
Demonstration projects
Global Agriculture project
For many applications local weather time series are needed for offline analysis of crop development and productivity on, for instance, experimental farms or breeding stations. An easy-to-use interface will enable this, and it will be possible to download data in a format ready to be used to drive commonly used crop models.
Satellites are able to assess total vegetation productivity and its related water use (evaporation) at high spatial resolution. However, we generally do not consume the total biomass of crops but only its seeds. By converting climate data into crop-development stages we can assess which part of the crop productivity/water use goes to the vegetative part of the plants and which to the reproductive parts that we eventually eat. Combining the strengths of the Copernicus Global Land Service with those of the Climate Change Service will thus enable assessments of the much sought-after harvest index.
https://climate.copernicus.eu/global-agriculture-projectDemonstration projects
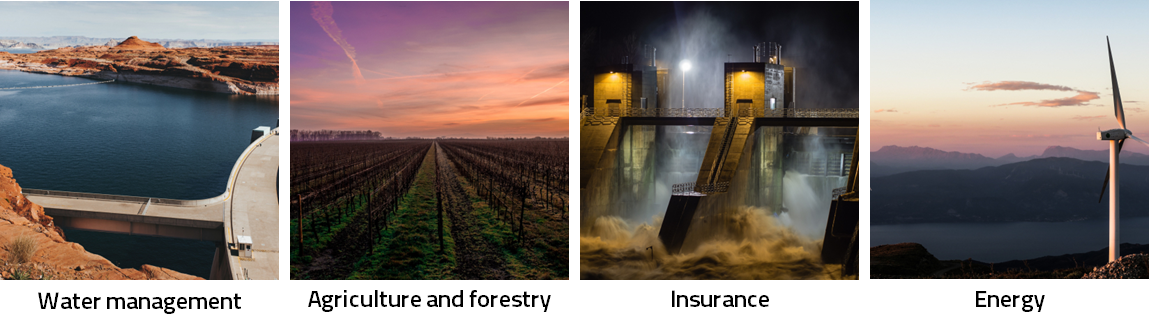
Climate Advisory Services for Agriculture
Climate change is likely to have a significant impact on forestry and agriculture. Rising C02 concentration, higher temperatures, changes in precipitation and soil moisture availability will all have significant effects on crop and tree growth.
The Agricultural Climate Advisory Services (AgriCLASS ) was one of the proof of concept projects of the SIS. The project developed datasets and tools to help the agriculture sector use data to adapt to climate change. Through a combination of climate, agriculture data and models it was possible to generate region-specific products. These products provided users with the information they needed to understand how crops are likely to be affected by climate change in the future.
https://climate.copernicus.eu/climate-advisory-services-agricultureDemonstration projects
Climate Advisory Services for Agriculture
Agriculture and food supply will be affected by the new conditions for crop and plant growth brought about by climatic changes. This could range from changes in the frequency of pests and disease outbreaks (biotic disturbances) to wildfire occurrence and wind storm frequency (abiotic disturbances).
By looking at diverse regions and industries, we are creating a set of tools that use climate and agricultural data to help the sector adapt to the challenges it faces.
https://climate.copernicus.eu/climate-advisory-services-agriculture
Demonstration projects
Climate Advisory Services for Agriculture
AgriCLASS allowed the agricultural sector users and the policy makers to view current and projected data on agricultural conditions. The AgriCLASS web portal (now superseded by CDS toolbox) delivered data on Europe for visualisation, inspection and download.
The data included Bioclimatic Indicators: the features of the climate that are relevant to biological information and the conditions that are needed for growing. AgriCLASS provided data on multiple bioclimatic such as temperature and precipitation.
https://climate.copernicus.eu/climate-advisory-services-agriculture
Demonstration projects
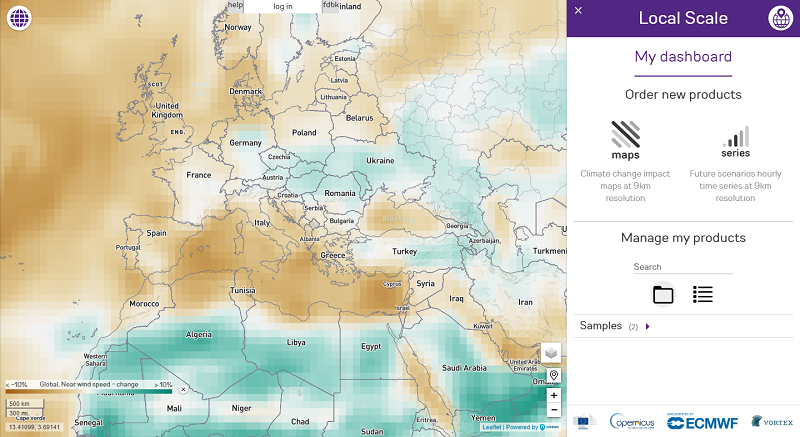
Climate Scale: On-demand high-resolution climate change data and intelligence

Solution: Using data provided by the Copernicus Climate Change Service (C3S), Climate Scale is a website implemented by wind modelling company Vortex that provides an unrivalled global service of on-demand high-resolution simulations of the historical climate (based on ERA5) and future climate projections (based on CMIP5 global climate models).
Demonstration projects
Climate Scale: On-demand high-resolution climate change data and intelligence
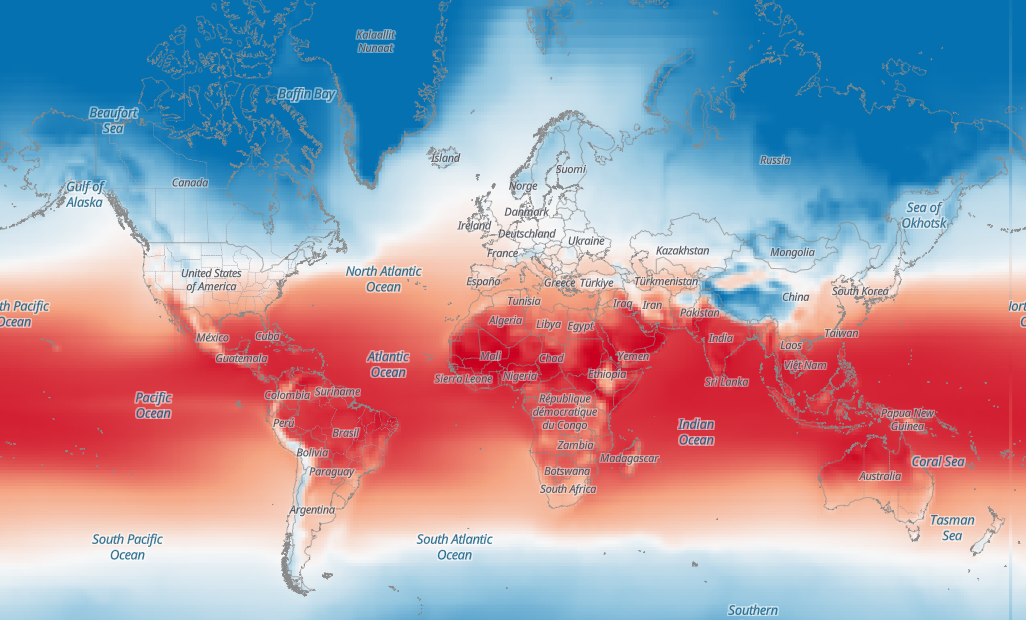
Solution: This information allows users to identify key changes and trends in climatic features relevant to their region of interest. Climate Scale complements the data with Climate Intelligence Services customised to provide clients with information about the uncertainty and robustness of the downscaled data to inform their climate risk management solutions.
Demonstration projects
Climate Scale: On-demand high-resolution climate change data and intelligence
 https://climate.copernicus.eu/climate-scale-demand-high-resolution-climate-change-data-and-intelligence
Demonstration projects
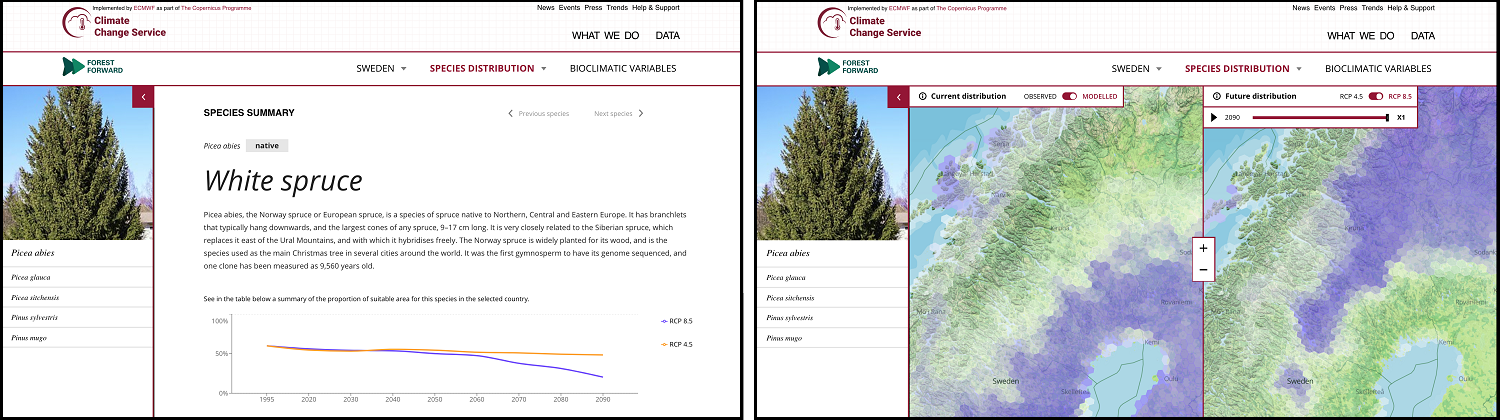
Forestry services based on C3S data
To illustrate the potential of C3S data for developing forest-oriented applications, a prototype application has been developed. Forest Forward uses C3S data to inform business owners and technical staff about the impacts of climate change on the distribution of species of value to the forestry industry. The information is communicated using maps and charts that synthesise and facilitate the access to high quality scientific
https://climate.copernicus.eu/forestry-services-based-c3s-data
Demonstration projects
Forestry services based on C3S data
Forest Forward predicts how the distribution of commercially important tree species will change over the next nine decades under two climate change scenarios: 'Slowly Declining Emissions' and 'Rising Emissions'. The demonstrator app aims to encourage and contribute to a different approach to long-term planning in the forestry sector — one based on climatic and species spatial distribution models and data. By informing their business strategy with high quality scientific evidence, the forestry sector can increase its resilience to the impacts of climate change.
https://climate.copernicus.eu/forestry-services-based-c3s-data
Demonstration projects
Forestry services based on C3S data
https://climate.copernicus.eu/forestry-services-based-c3s-data
Demonstration projects
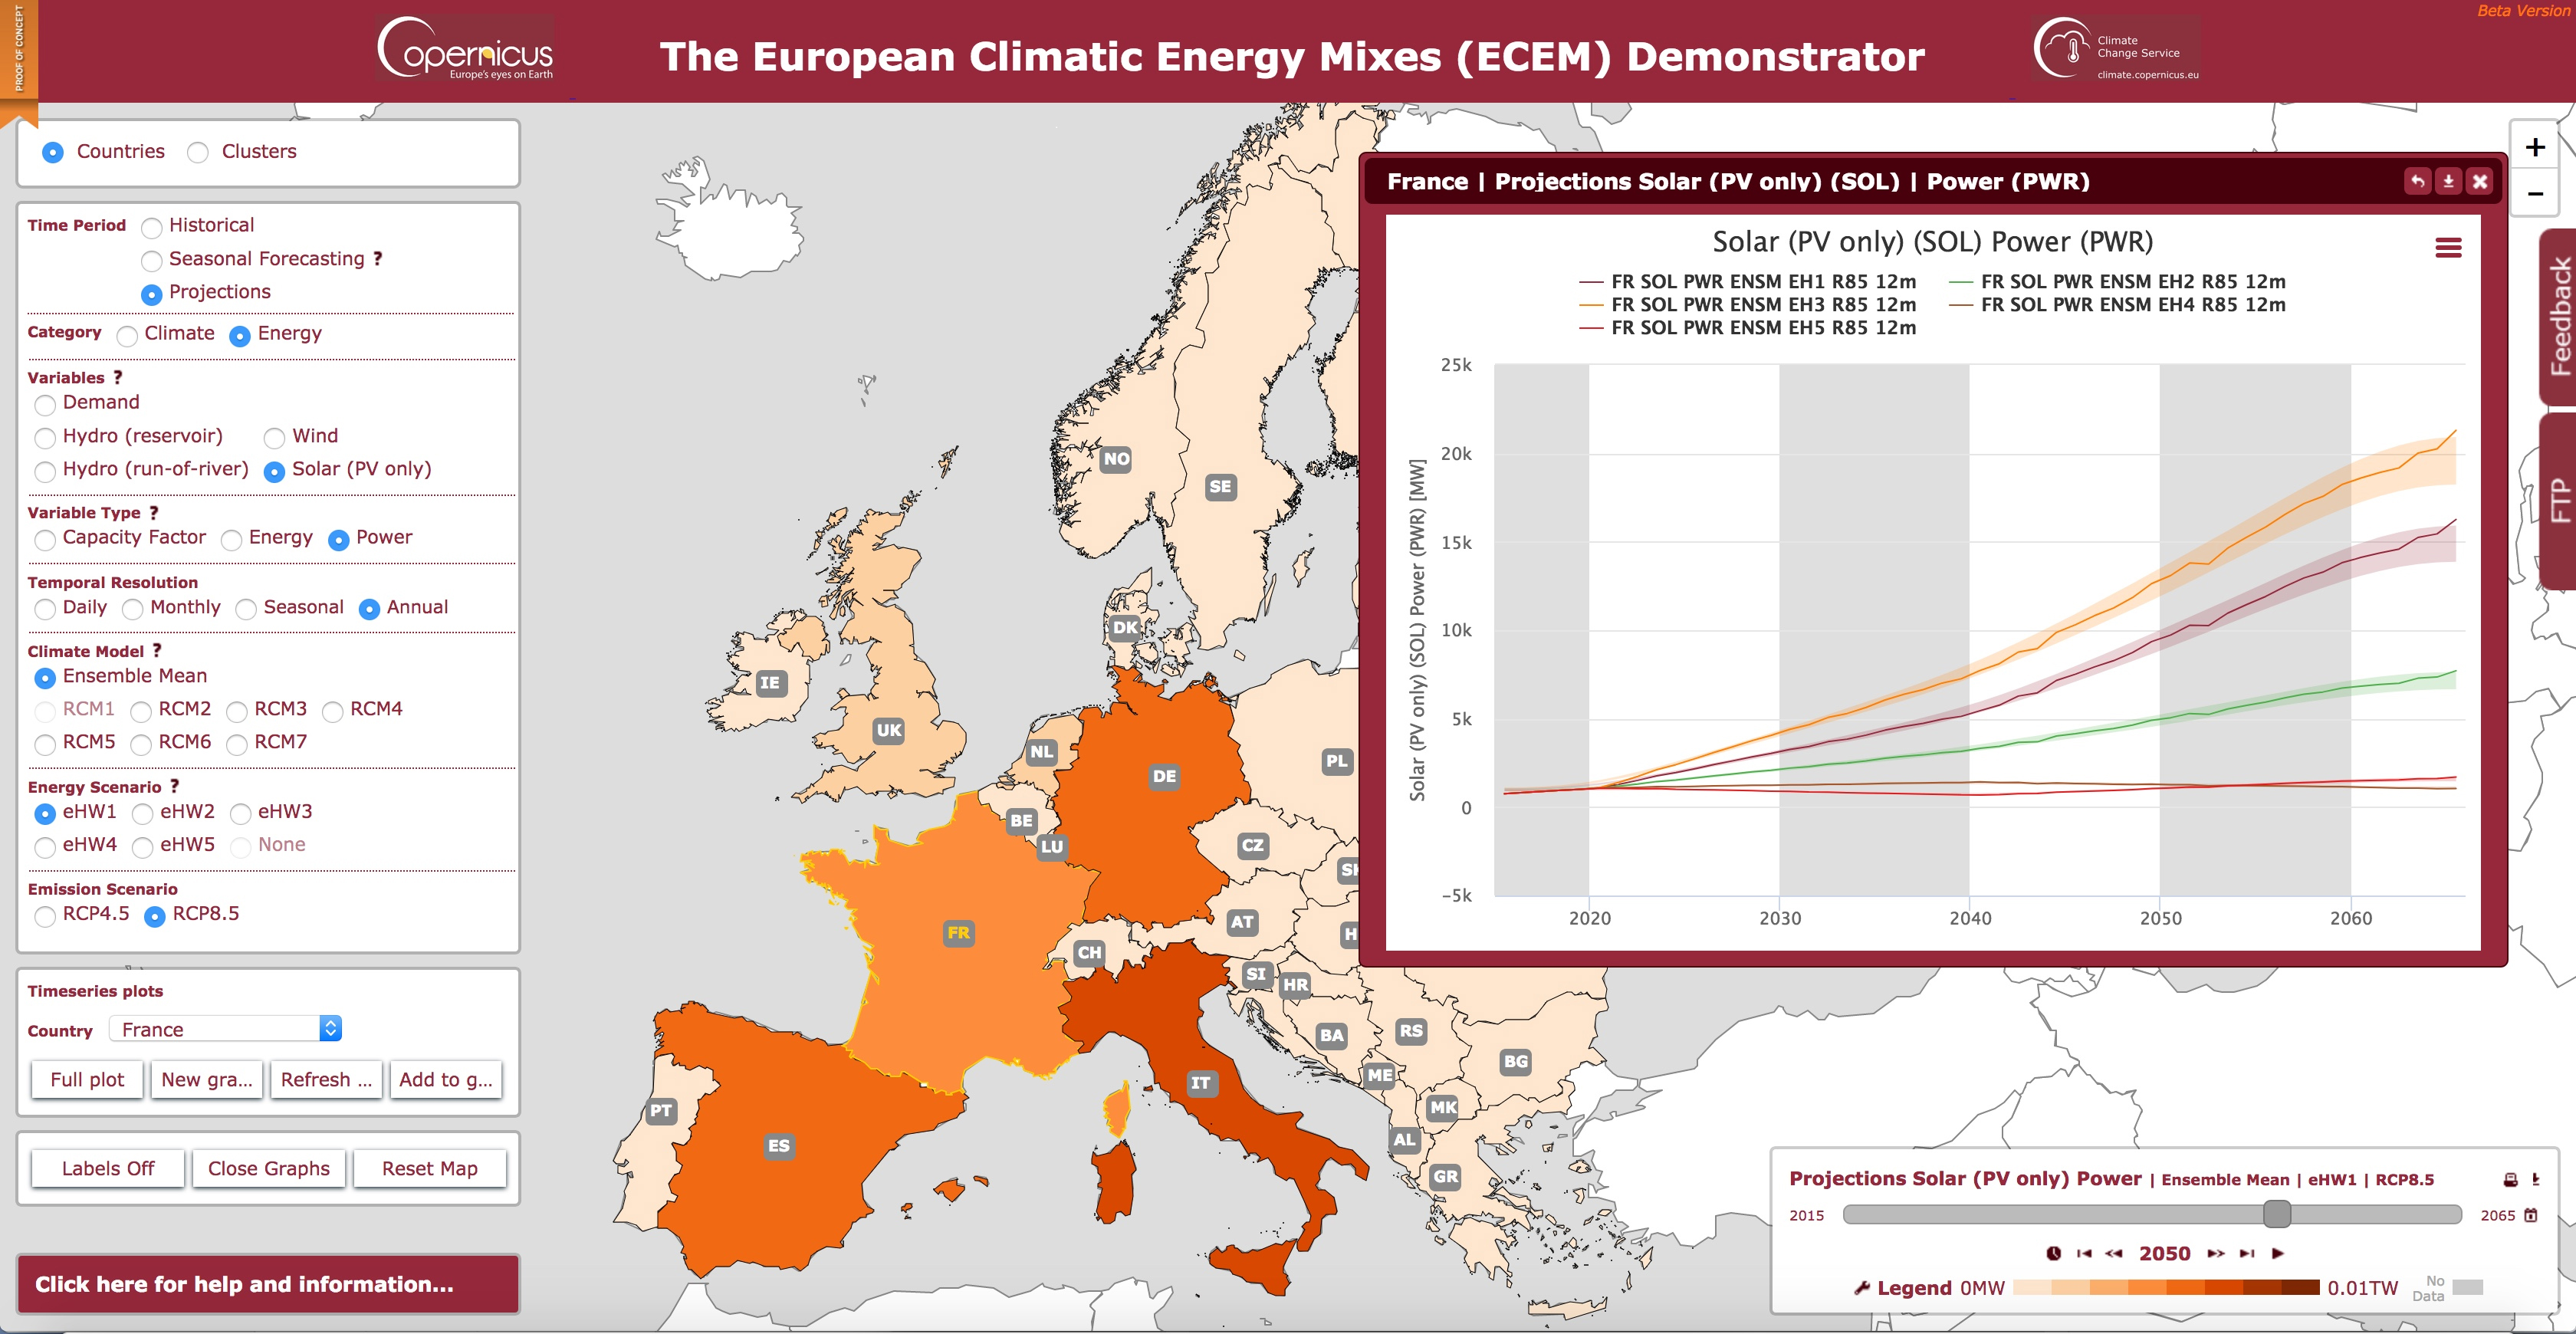
Operational service for the energy sector
The C3S Energy operational service aims to deliver key information for climate-related indicators relevant to the European energy sector.
This includes data in terms of:
- electricity demand
- the production of power from wind, solar and hydro sources
https://climate.copernicus.eu/operational-service-energy-sector
Demonstration projects
Operational service for the energy sector
https://climate.copernicus.eu/operational-service-energy-sector
Demonstration projects
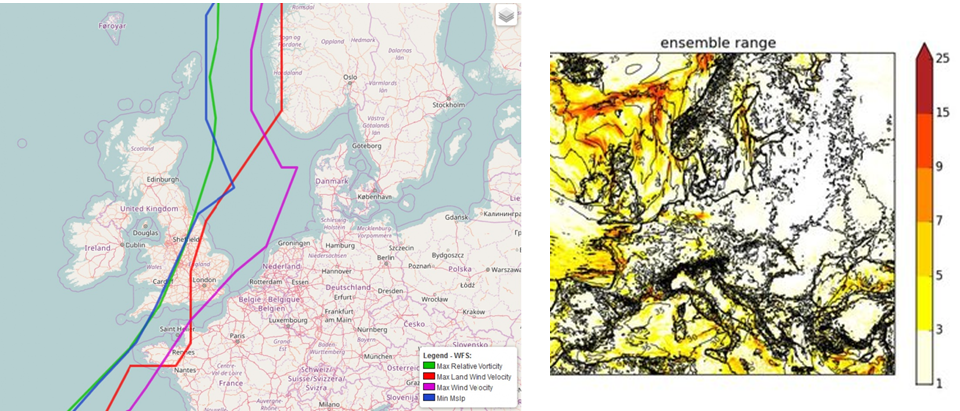
Windstorm Information Service
To improve understanding of past windstorm events WISC provides an extended database of historical windstorm tracks, high resolution footprints and annual and decadal Tier 1 indicators of windstorm occurrence and severity.
WISC provides Tier 3 indicators of historical windstorm losses, based on a detailed exposure and vulnerability database.
To support modelling of windstorm risk, WISC provides an Event Set consisting of 7,660 physically realistic windstorm events, based on outputs of 5 ensembles of climate simulations running under the conditions of 1985 to 2011.
Demonstration projects
Windstorm Information Service
The Event Set is provided in a format compatible with the OASIS Loss Modelling Framework and WISC is also planning to migrate its exposure and vulnerability data to be used on the OASIS platform.
The dedicated WISC portal can be accessed at https://wisc.climate.copernicus.eu/wisc.
The portal supports download of the WISC data as well as searching, visualisation and supporting documentation.
Demonstration projects
Windstorm Information Service
https://climate.copernicus.eu/windstorm-information-service