Flood mapping with Synthetic Aperture Radar
 (© contains modified Copernicus Sentinel data (2019), processed by ESA, CC BY-SA 3.0 IGO,
source)
(© contains modified Copernicus Sentinel data (2019), processed by ESA, CC BY-SA 3.0 IGO,
source)
Welcome to this course
This course is a basic course on mapping of floods using radar remote sensing data.
It has been prepared primarily using modified EO College resources available under CC BY-SA 4.0 license. In case of using other materials, appropriate references / copyrights have been provided.
You can navigate through vertical slides by pressing the Down / Up keys on your keyboard or the navigation arrows at the bottom-right of each slide. You can get the overview of all slides by pressing ESC key.Learning Objectives
Understand basics of imaging radar
Understand interaction between Synthetic Aperture Radar (SAR) signal and water
Apply flood mapping using SAR data
Content of this course
1. What is a flood?
2. Why use radar remote sensing?
3. Physical properties of water
4. Principles of imaging radar
5. Parameters influencing SAR image: sensor parameters
5. Parameters influencing SAR image: object parameters
6. SAR backscatter from water
7. Flood mapping: best practice
8. Flood mapping: hands-on
9. References
What is a flood?
- Water submerging usually dry land
- Occurs along rivers, lakes, sea shores or in flat areas saturated with water (e.g. after heavy rain)
- Causes physical damage and affects water, food and crops supplies and supports spread of water-borne diseases
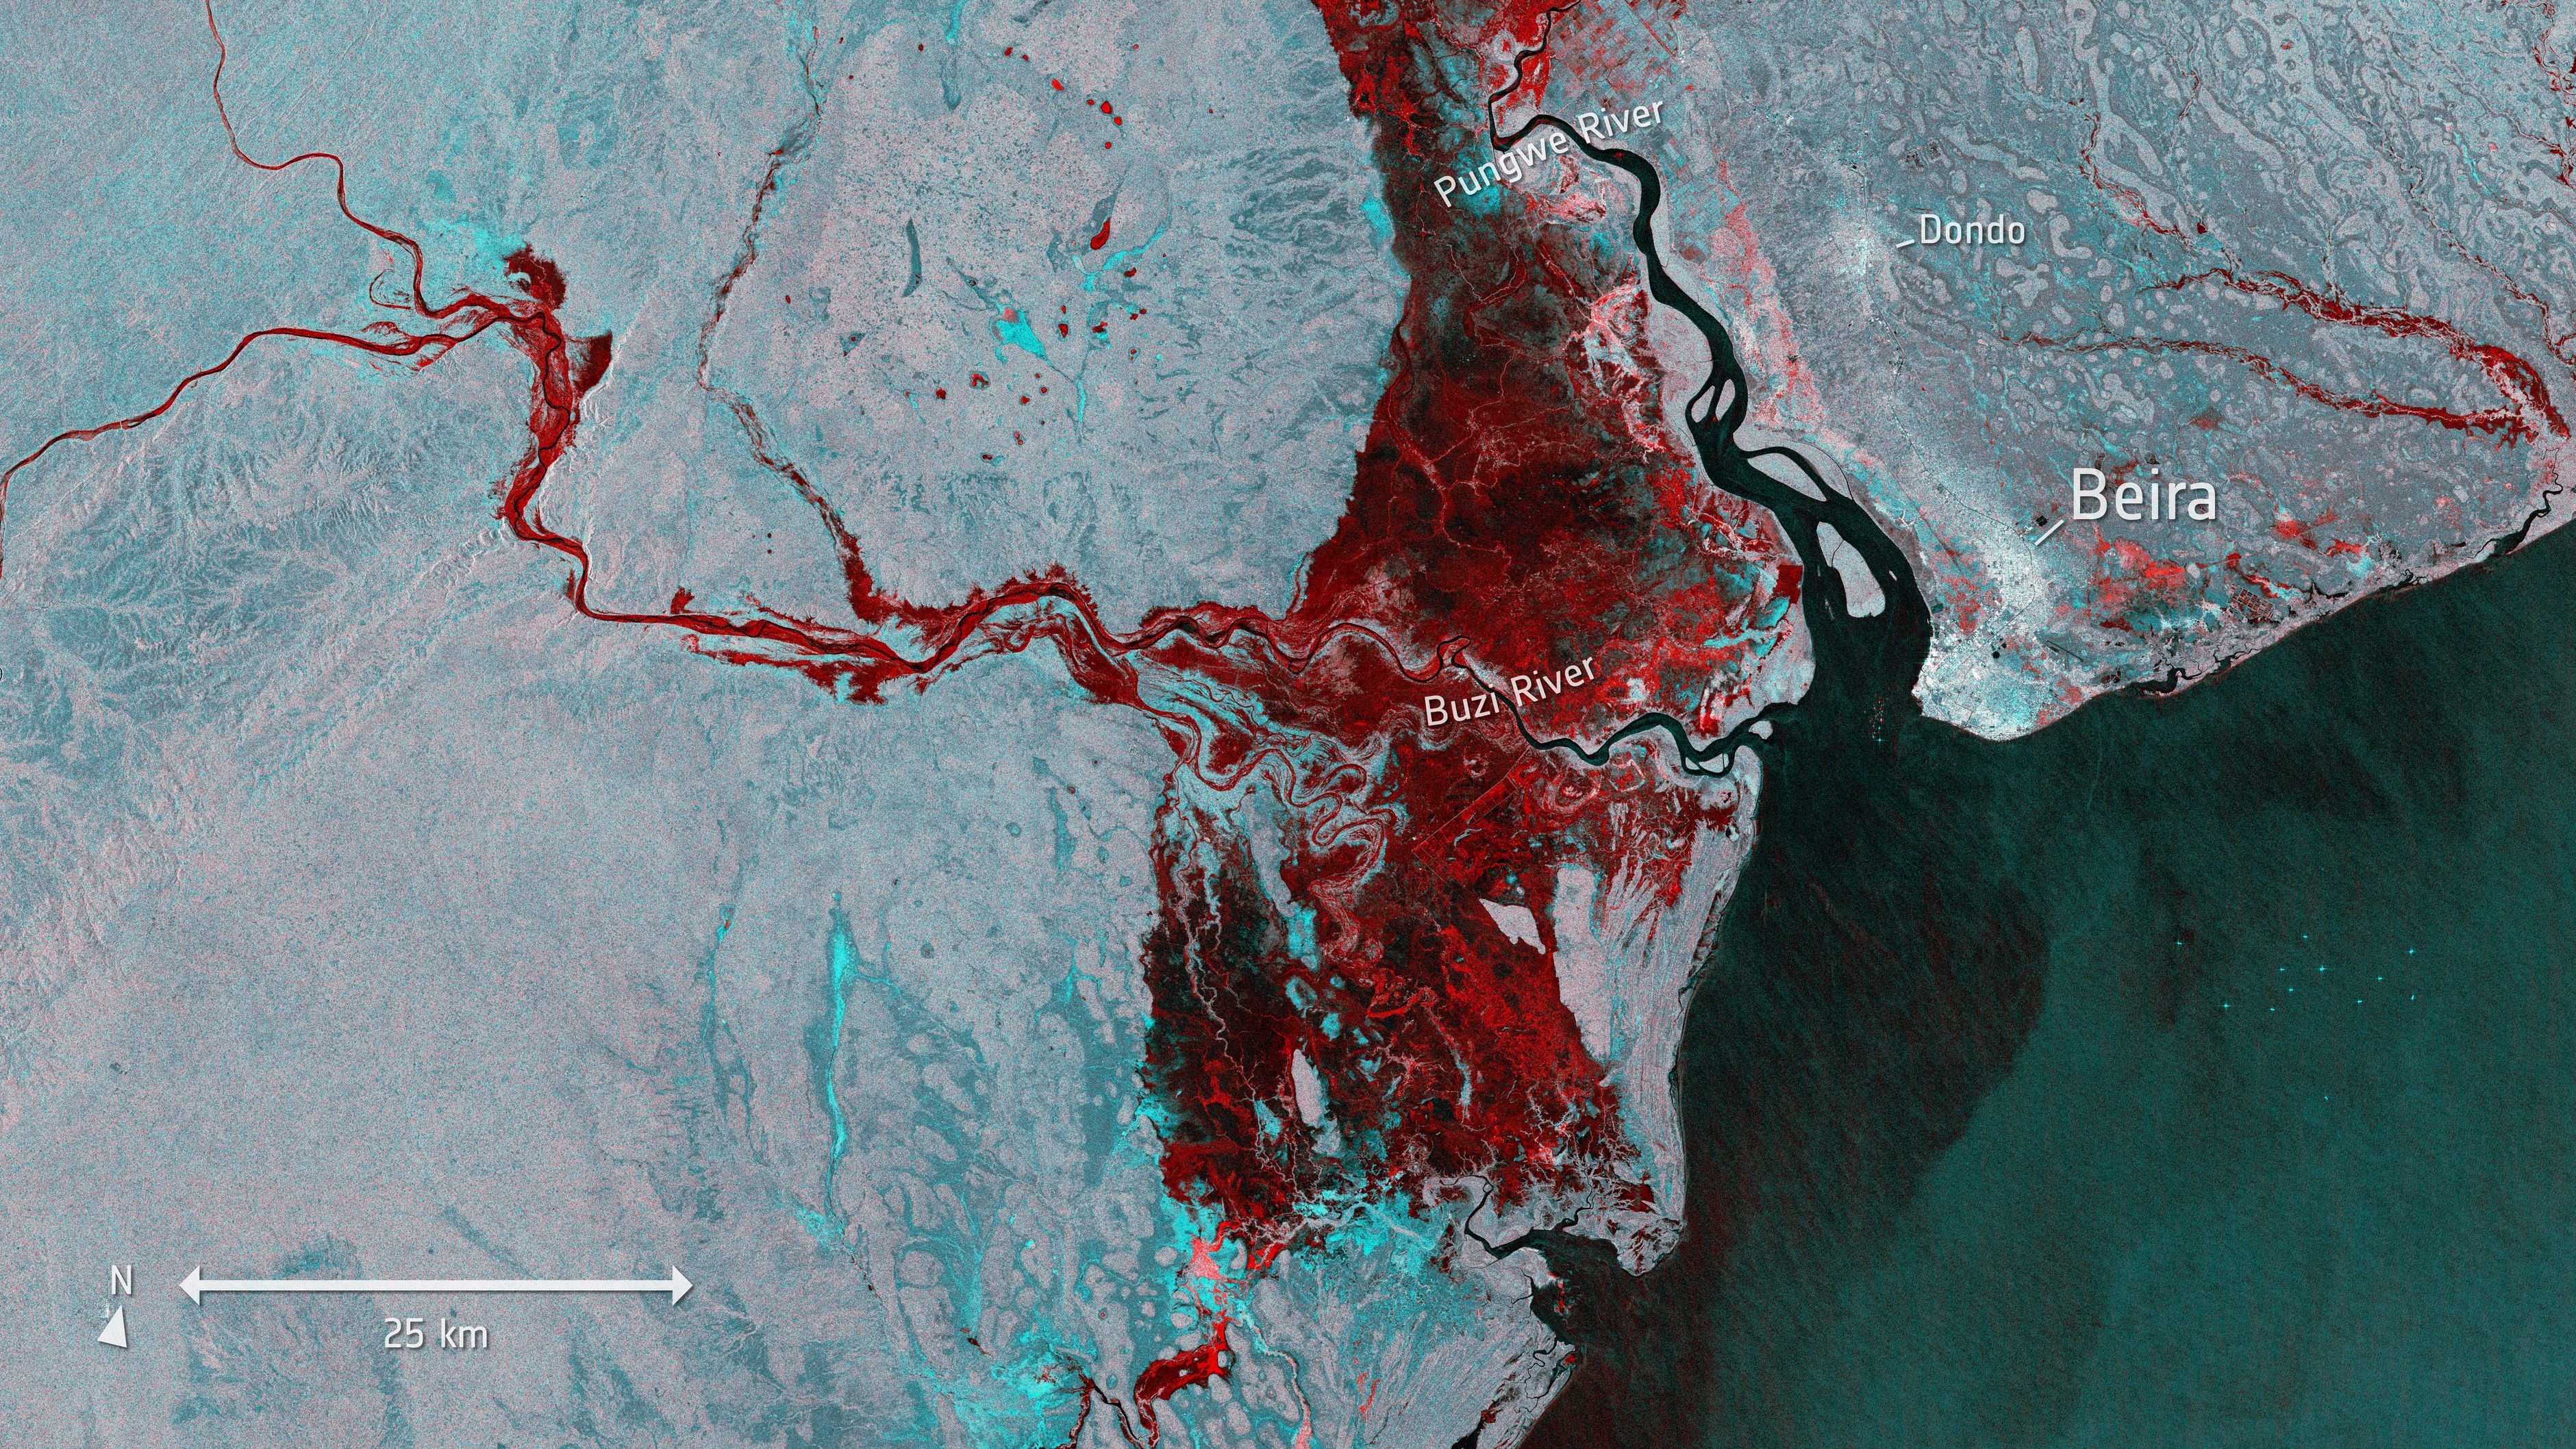 Floods caused by Cyclone Idai imaged by Copernicus Sentinel-1 (© contains modified Copernicus Sentinel data (2019), processed by ESA, CC BY-SA 3.0 IGO,
source).
Floods caused by Cyclone Idai imaged by Copernicus Sentinel-1 (© contains modified Copernicus Sentinel data (2019), processed by ESA, CC BY-SA 3.0 IGO,
source).
Why use radar remote sensing?
Mapping water with the microwave portion of the electromagnetic spectrum is one of the major application fields of radar remote sensing.
- All weather capability - penetrates clouds
- Independent of sun illumination - day and nigth operation
- Sensitivity to dielectric properties - sensitivity to water content
- Clear distiction between water surfaces and land
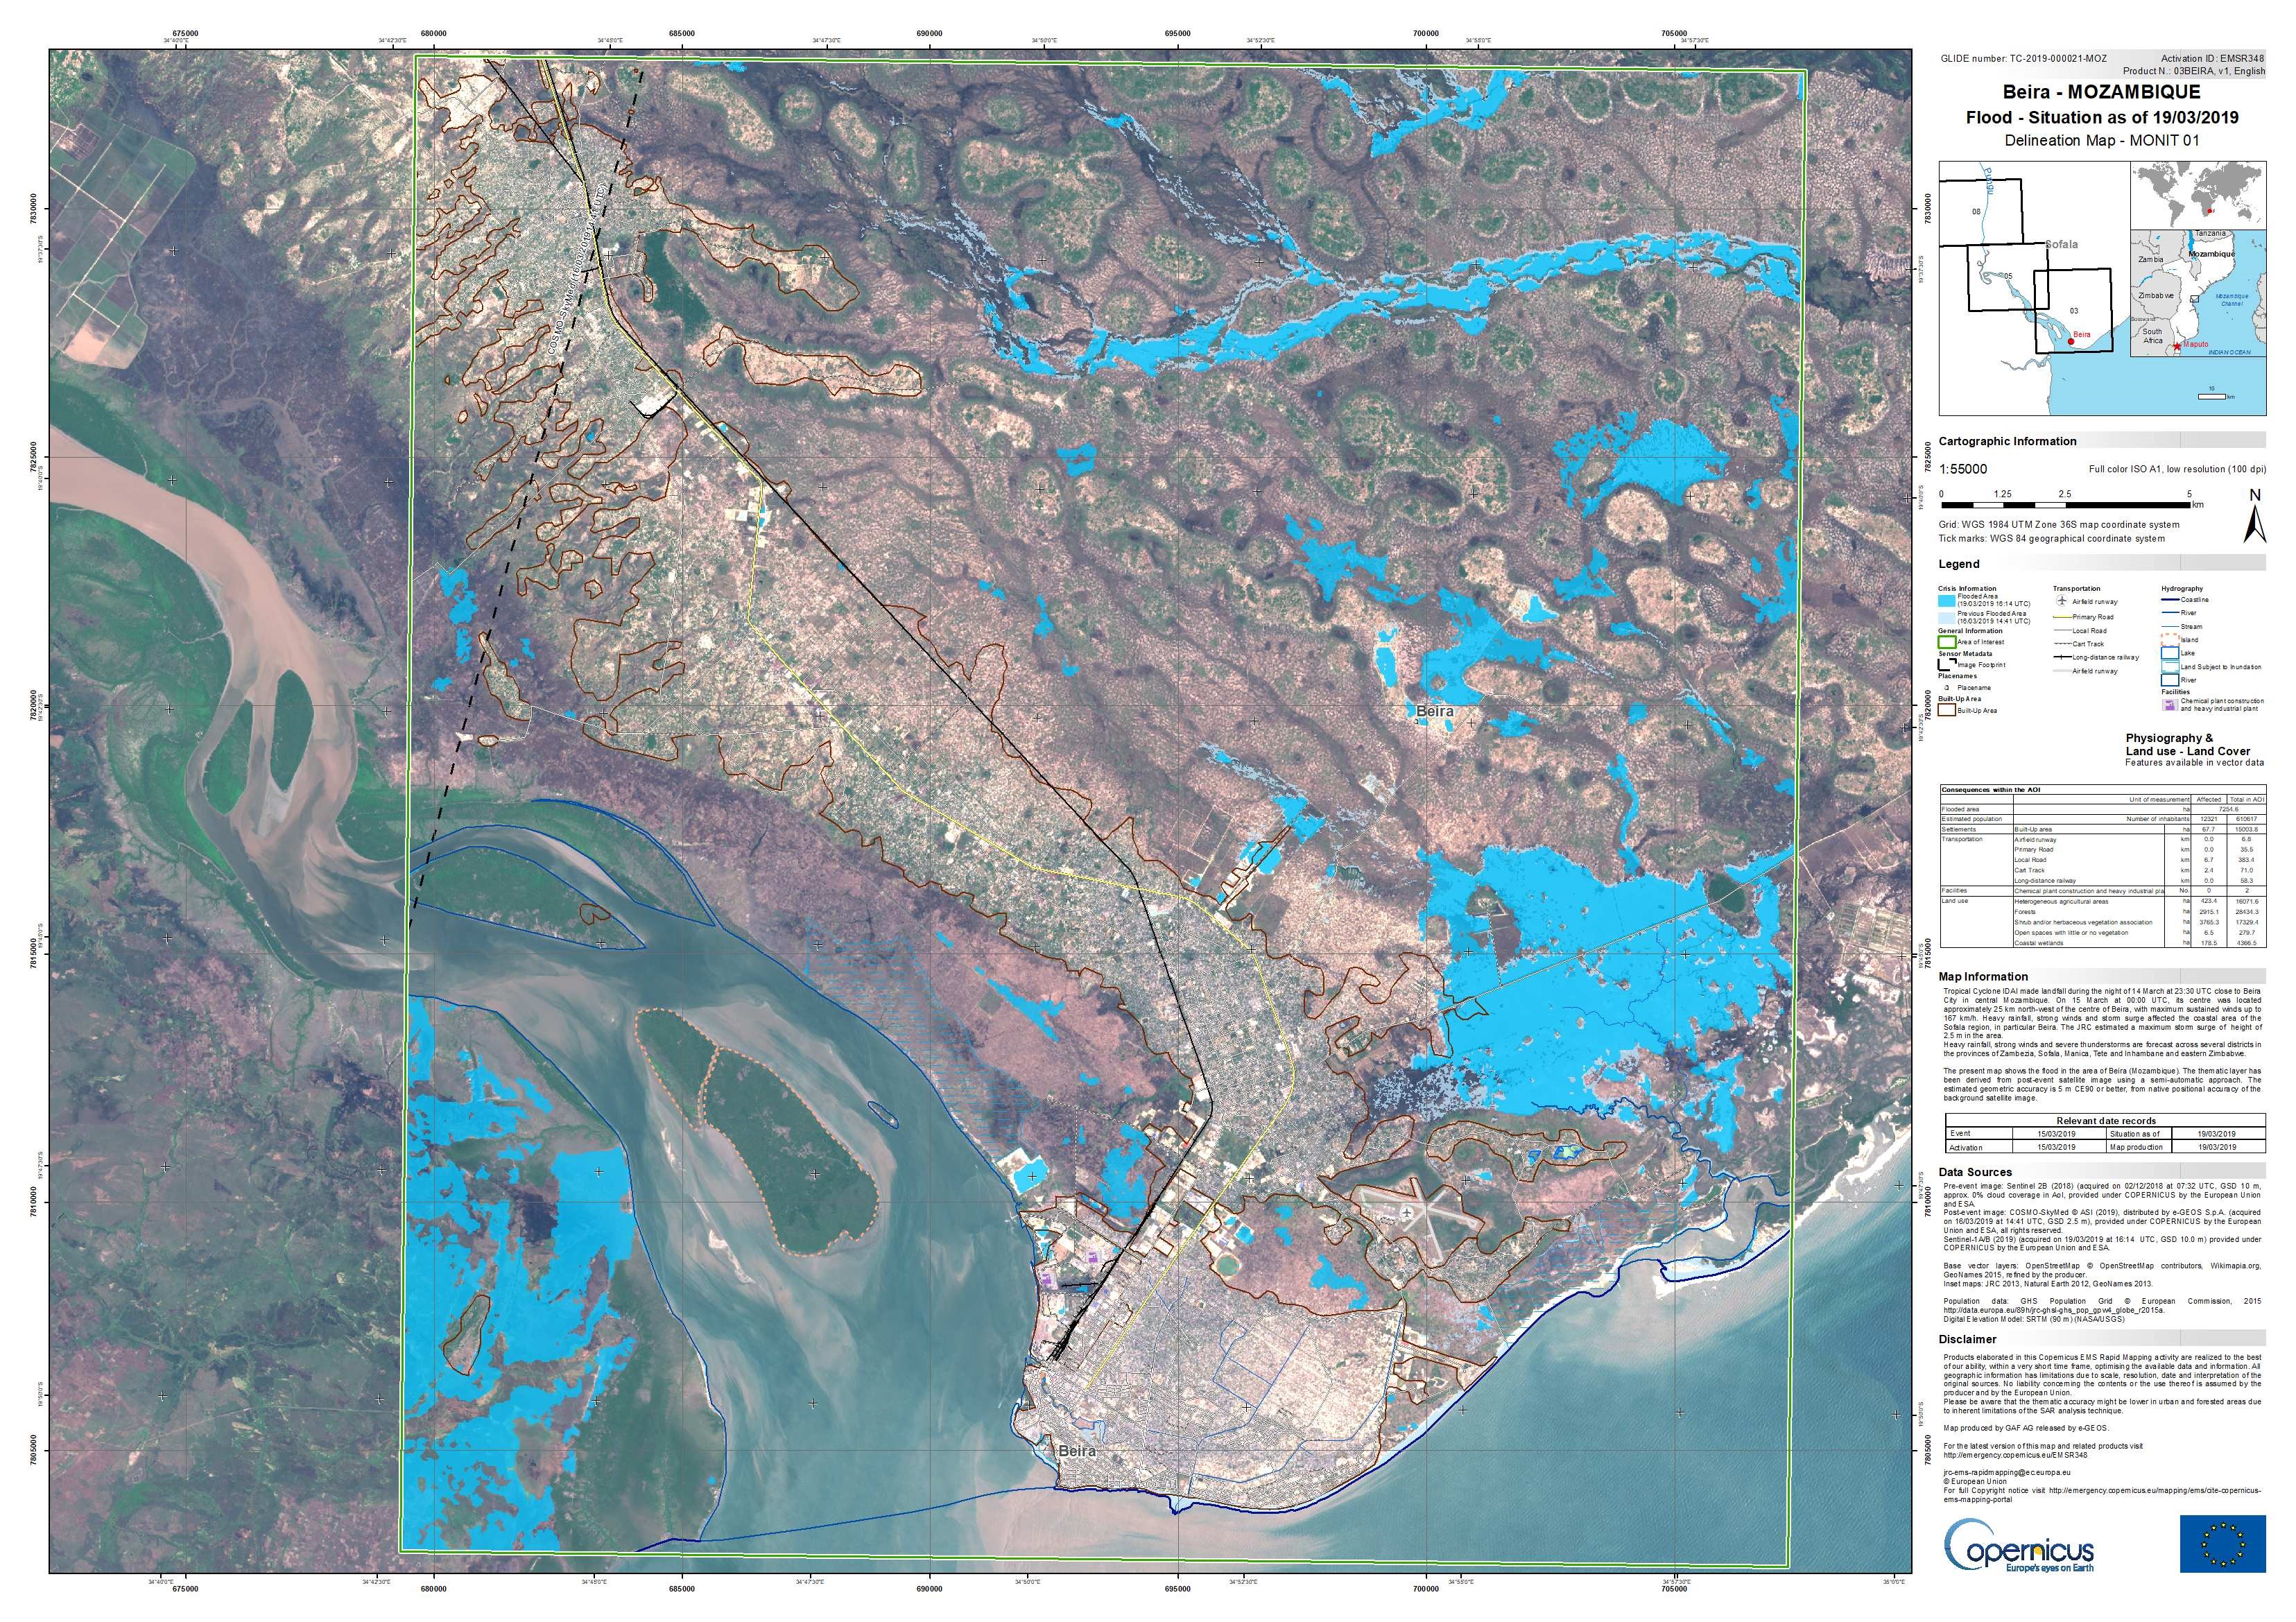
Copernicus Sentinel-1 maps floods from Idai (© contains modified Copernicus Sentinel data (2019), Cosmo-SkyMed, processed by GAF AG/e-GEOS/CMEMS, source).
Water - Physical properties
- H2O acts as a dipole.
- Dipole = pair of two commensurate and opposite electric charges
- It can be orientational polarized.
- Orientational polarization depends on:
- Temperature
- In ice (frozen water) the H2O dipole are immobilized and therefore show no orientational polarization
- Frequency of the alternating electric field
- Above a certain frequency – the relaxation frequency – the dipoles cannot follow the oscillations of the electric field any longer → Microwave remote sensing of water / soil moisture is possible only below the relaxation frequency of water (≈10 GHz)!
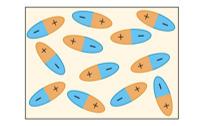
Polar H2O molecules are randomly oriented when no electric field is present.
If an external electric field (E0) is applied, the H2O molecules partially align with the field: they are orientational polarized.
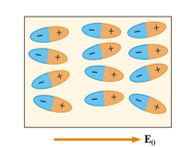
Orientational polarization of polar molecules (Serway & Beichner, 2004)
Water - Dielectric properties
- If dipoles are orientational polarized they show strong interaction with electric field → high dielectric constant (εr).
- Dielectric constant of a material (e.g. soil) is directly related to its water content.
- Dielectric properties determine scattering and attenuation characteristics of a medium. (attenuation = decrease in the strength of a signal as an electromagnetic wave travels through a medium)
- Dielectric constant is a dimensionless parameter. It is low for dry and high for wet mediums / objects.
- Examples:
- dry soil: εr ≈ 2-4
- water: εr ≈ 73 (at 5 GHz [C-band, e.g. Sentinel-1] and 20°C)
- As an electromagnetic wave travels through a medium (water) its energy is exponentially attenuated.
- Penetration depth into water surfaces is very small (in the range of a few millimeters).
- Penetration depth is defined as a function of the dielectric constant and the wavelength.
- The longer the wavelength the greater the penetration depth at a given dielectric constant.
- The larger dielectric constant the smaller the penetration depth at a given wavelength.
Water - Summary
- Liquid water as an abundant natural material shows orientational polarization.
- Water surfaces or very wet soils show high dielectric constant.
- Impinging wave on calm water is scattered back almost entirely.

© pixbay (source)
Principles of imaging radar
- RADAR: RAdio Detection And Ranging
- Active microwave imaging system - system transmits energy (pulses) and detects reflected responses (echos) from objects
- Energy is tranmitted and recorded by radar antenna: Real Aperture Radar (RAR, airborne), Synthetic Aperture Radar (SAR, satellite) systems.
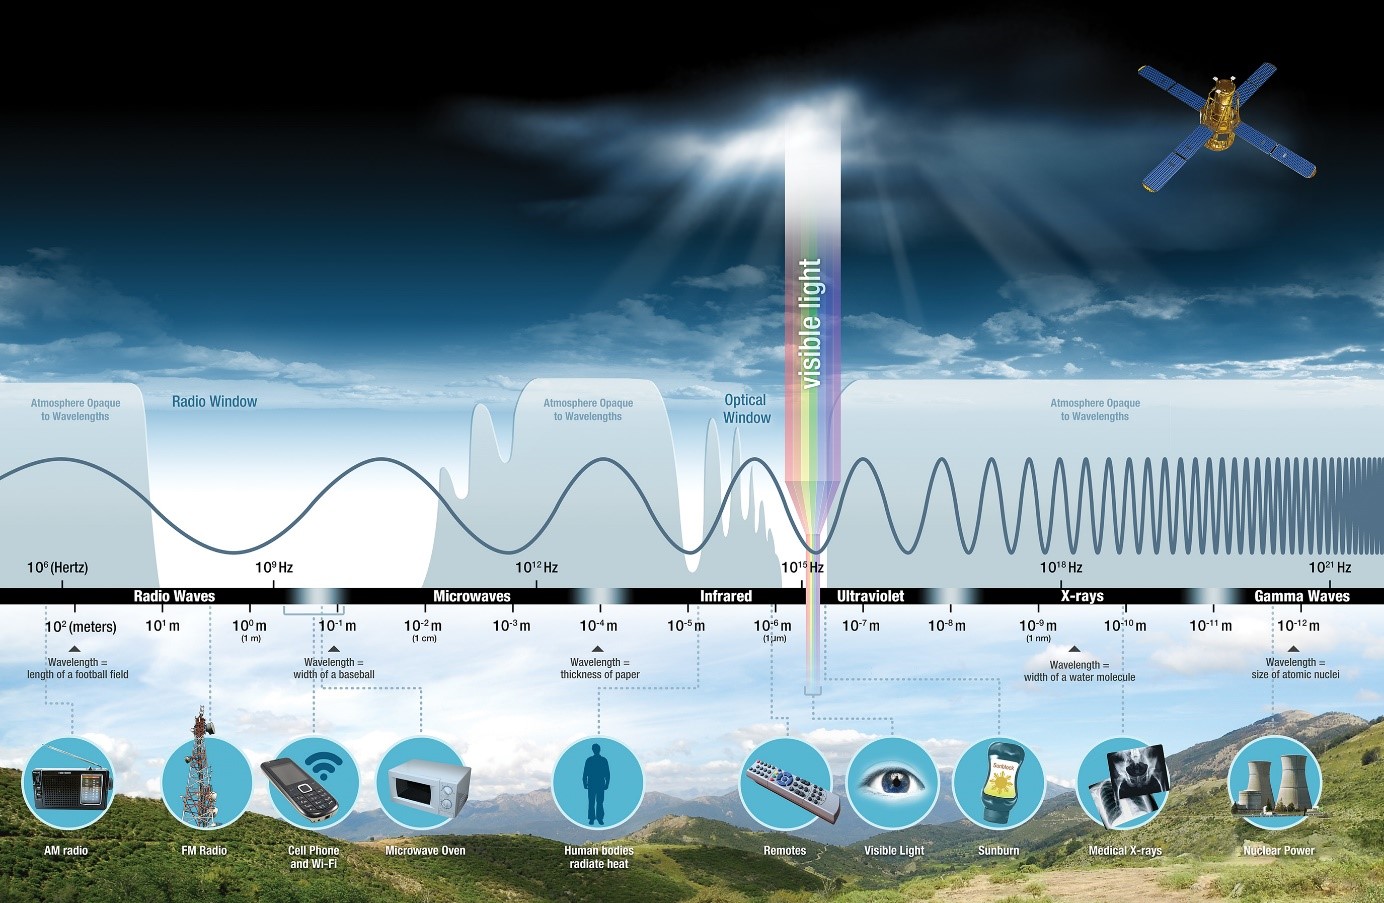
The electromagnetic spectrum (© EO Collge)
Learn more about the microwaves in this video (Tour of the EMS 03 - Microwaves, © ScienceAtNASA)
Side-looking acquisition geometry
To distinguish between objects, Synthetic Aperture Radar (SAR) systems operate in side-looking geometry.
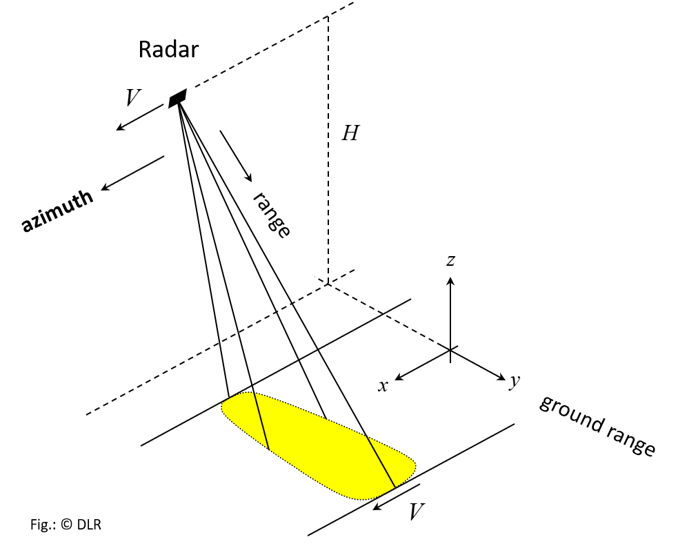
Radar Imaging Geometry (© DLR)
Azimuth: along-track direction, parallel to the radar flight path
Range: across-track direction, perpendicular to the radar fligth path
Ground range: range direction projected onto the Earth`s reference plane
Learn more about the basics of radar imaging geometry in these animations. They were created by Iain H. Woodhouse, forestplanet.wordpress.com.
Synthetic Aperture Radar (SAR)
- The spatial resolution in azimuth direction is directly related to the ratio of the sensor wavelength (λ) to the length of the sensor's antenna (Lreal): the larger the antenna, the finer the resolution.
- For a wavelength of about 5 cm (e.g. Sentinel-1), a radar antenna of approximately 3.5 km would be needed in order to get spatial resolution of 10 m.
- To enable the development of high-resolution radar systems in space, the concept of synthetic aperture radar was developed.
- Synthetic aperture is simulated through multiple subsequent positions of the real antenna along the fligth path.
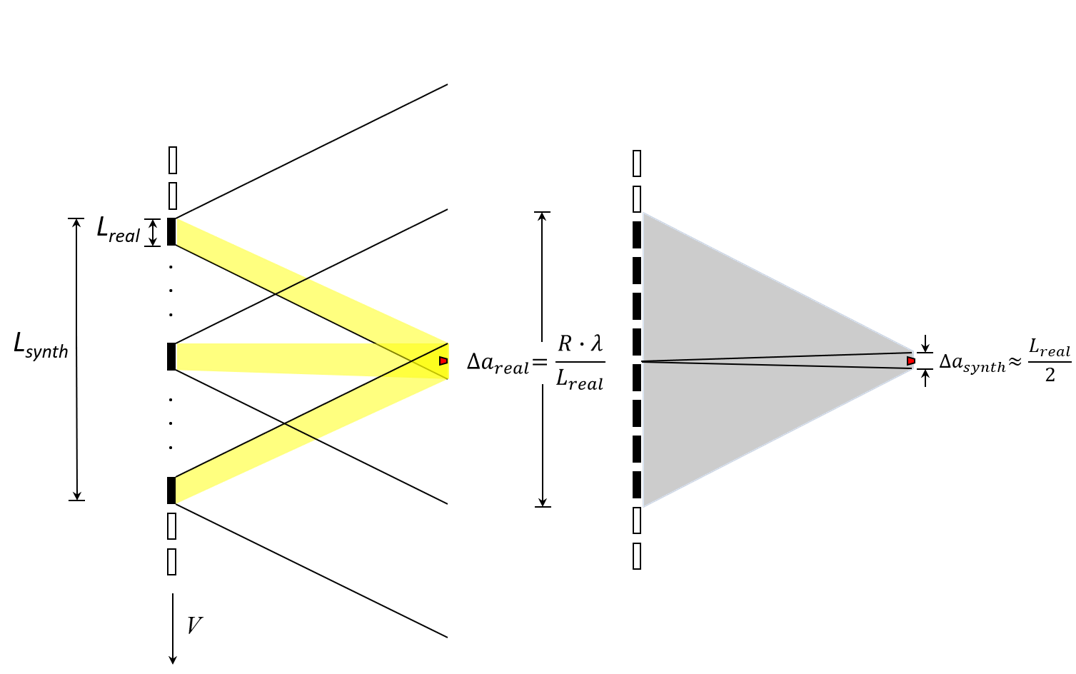
Concept of the Synthetic Aperture Radar; Lsynth represents a length of the synthetic radar antenna, Lreal is a length of the real radar antenna, V is sensor velocity, Δareal represents real resolution, Δasynth is synthetic resolution, R represents distance between the sensor and target, λ is a sensor wavelength (modified after DLR)
Learn more about the Spaceborne Synthetic Aperture Radar in this paper (Meyer, 2019).
SAR backscatter
- Basic SAR measurements provide the amplitude and phase as a complex image.
- Amplitude represents the amount of returning energy.
- A is the amplitude image and I=A2 the intensity image.
- Phase represents time delay information.
- The phase of a single image is not exploitable.
- To better interpret the SAR backscatter image, it is streched into the decibel values (dB). Low values represent flat water surfaces, high values man-made objects.

Example of a SAR intensity image, Thorn (Poland), the city of the birth of Nicolaus Copernicus (© contains modified Copernicus Sentinel data (2019), processed by FSU Jena)
Parameters influencing SAR image
Sensor parameters
- Wavelength/Frequency (X, C, L, P bands)
- Polarization (HH, VV, HV, VH)
- Incidence angle
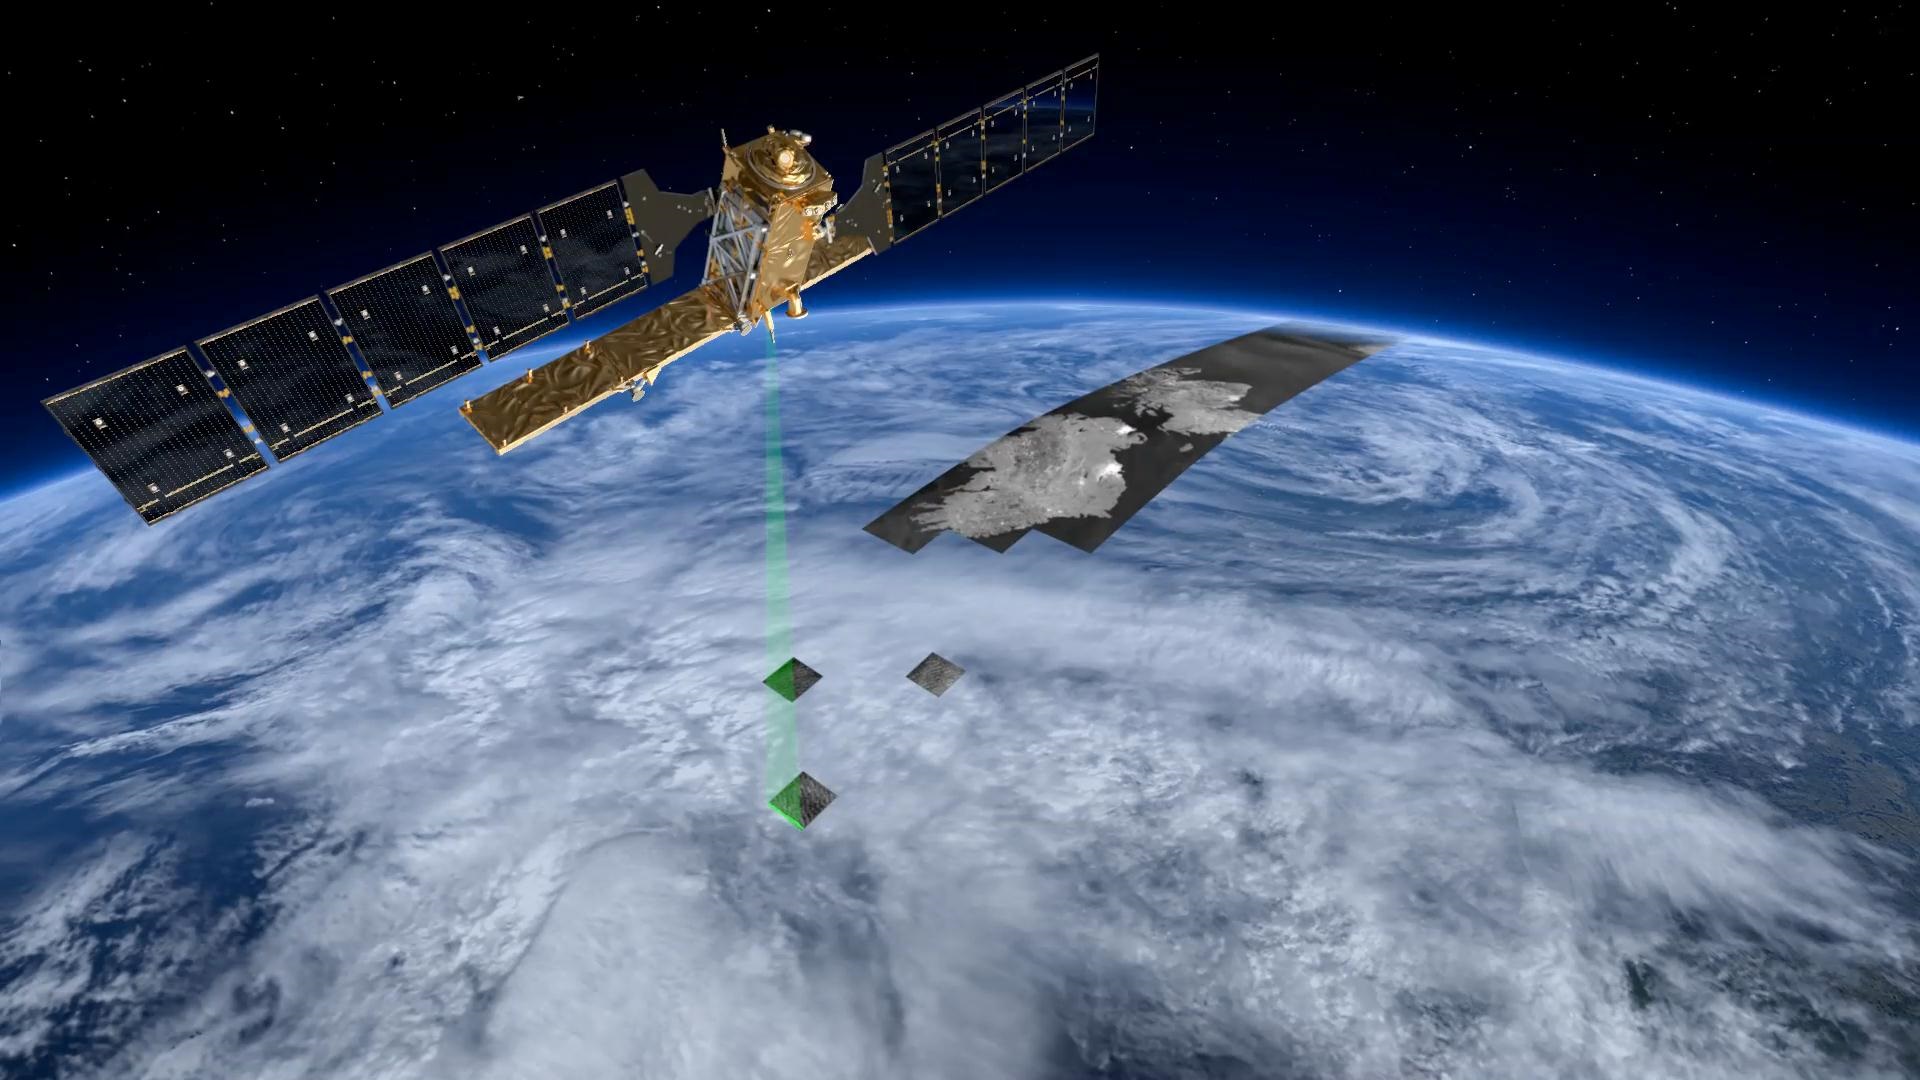
Sentinel-1 (© ESA/ATG medialab)
Wavelength/Frequency
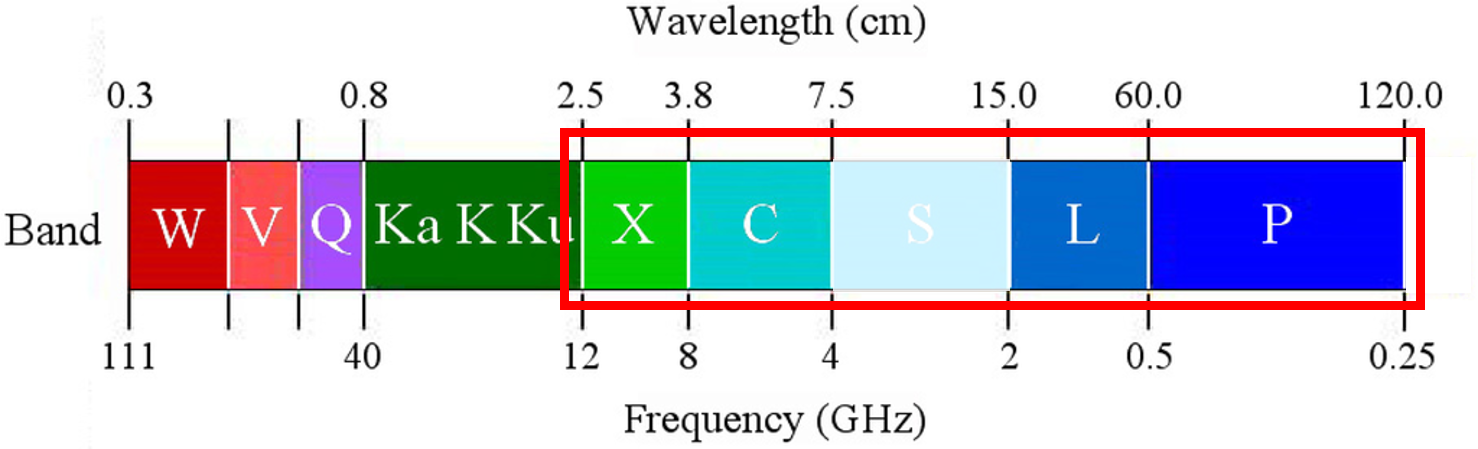
- The radar signals interacts with objects as large as or larger than the used wavelength. Smaller Objects are transparent to the radar signal.
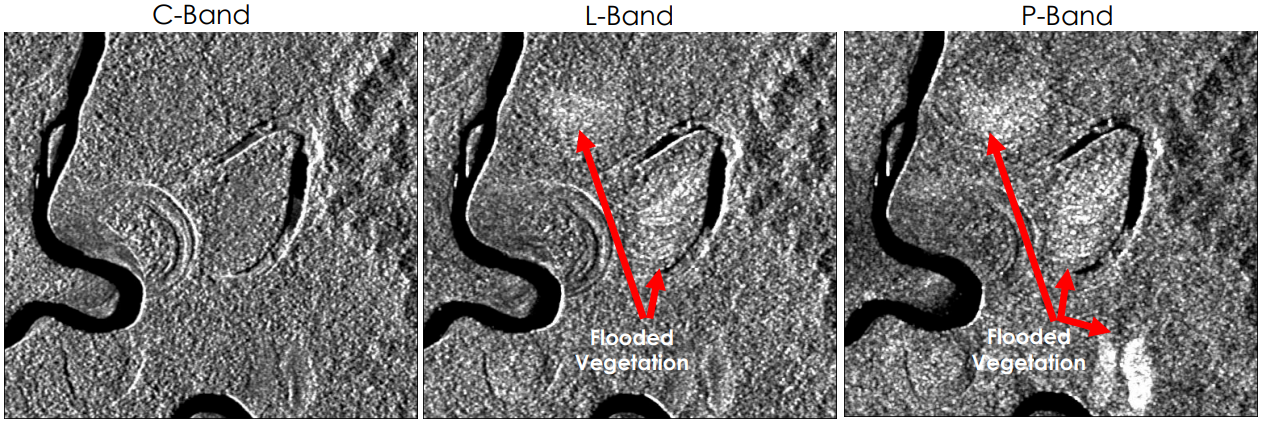
- The wavelength is linked to the penetration depth of the transmitted signal. Larger wavelengths can penetrate deeper into medium.
- Water surfaces can be well detected with all typical SAR wavelengths.
- For the detection of flooded vegetation, L-band wavelength or larger are preferred.
Polarization
Polarization characterizes the orientation of the transmitted and received electric field. The polarization of a transmitted wave can change through interaction with specific objects on the Earth’s surface.
- HH: horizontally transmitted, horizontally received
- VV: vertically transmitted, vertically received
- VH: vertically transmitted, horizontally received
- HV: horizontally transmitted, vertically received
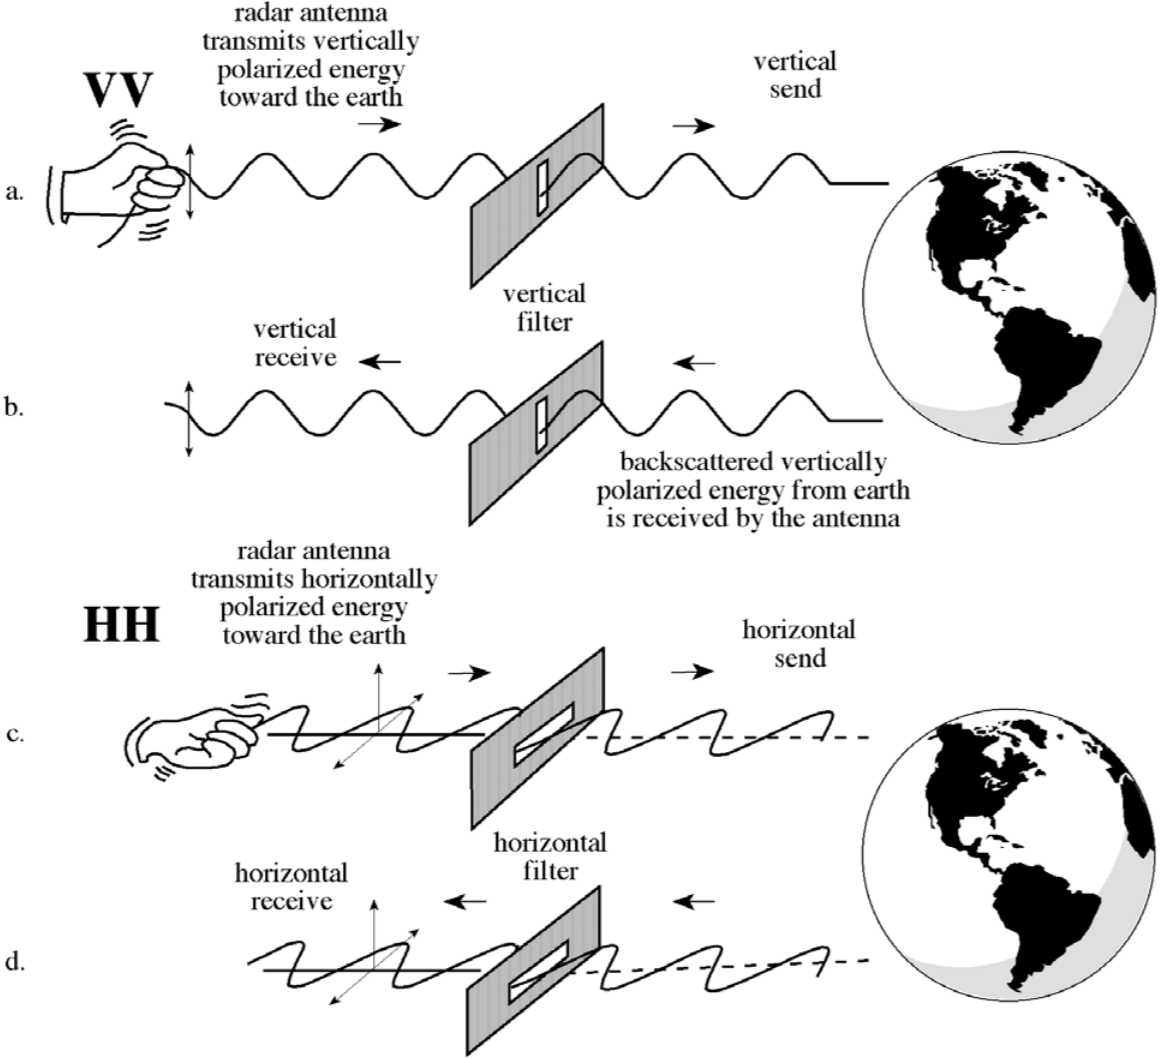
Examples of radar systems operating in VV and HH polarization (Jensen, 2000)
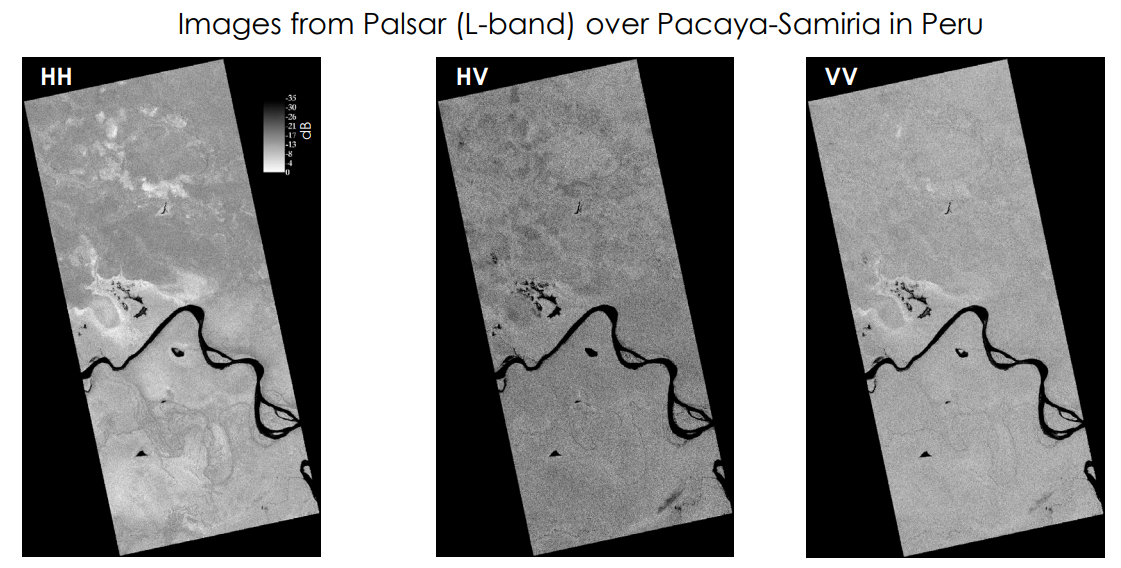
Co-polarized signals (HH, VV) area preferred for flood mapping under canopy cover, cross-polarized (HV, VH) signals are suitable for mapping open water surfaces.
Incidence angle
- The incidence angle characterizes the angle between the direction of illumination and the normal to the Earth’s surface. For a flat terrain, steeper incidence angles are usually found in near range and shallow incidence angles in far range.
- The signal path through a medium (e.g. vegetation canopy) is longer for shallow angles than for steep angles.
- The amount of returning signal is usually larger for steeper angles than for shallower angles.
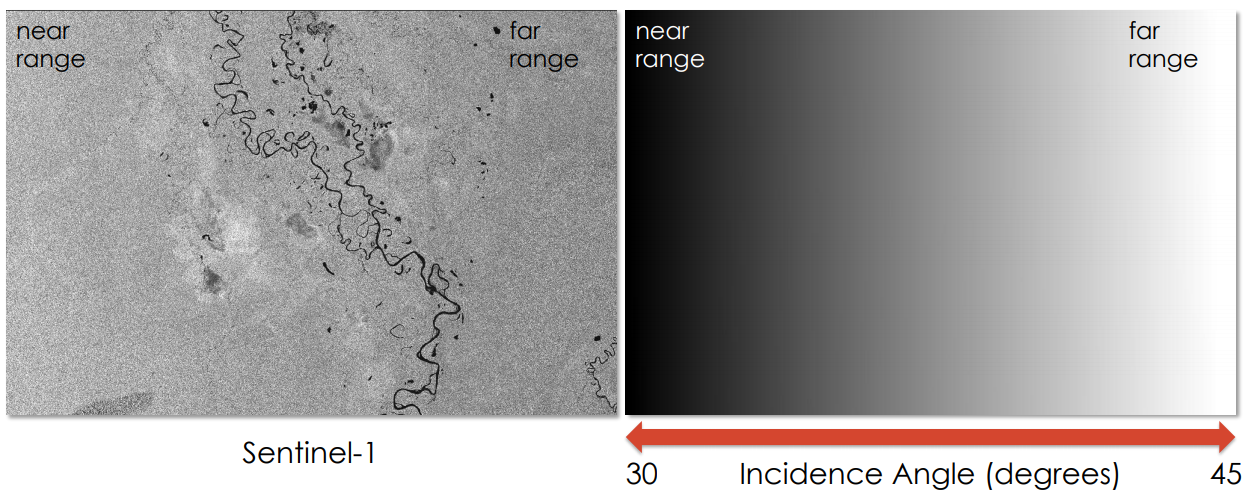
Effect of incidence angle variation (Podest, 2018; source)
Parameters influencing SAR image
Object parameters
- Water content
- Surface structure and roughness
- Local slope and orientation
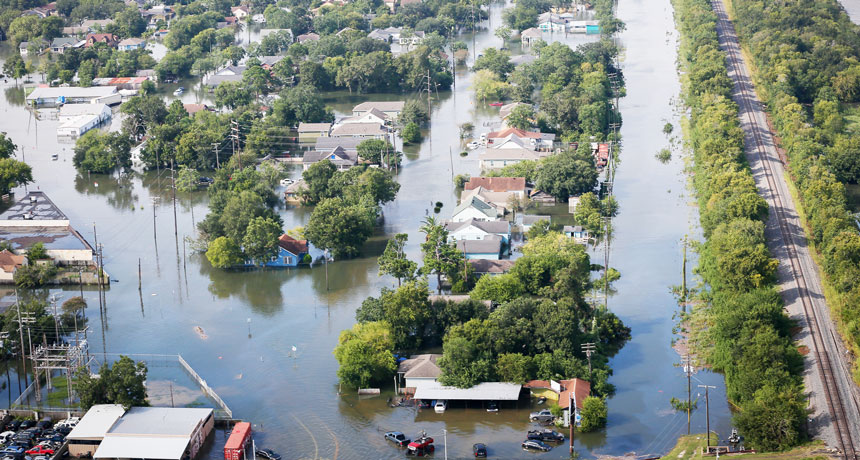
Example of flooded land by Hurricane Harvey in Texas in 2017 (© SC NATIONAL GUARD/FLICKR; source)
Water content
- The backscattered signal depends on the dielectric properties of illuminated objects.
- Dielectric properties of soil depends on:
- Water content
- Mineral and organic composition
- Soil air
- Salt content
- The wetter a soil, the more signal is returned and the brighter it appears in the SAR image (diffuse scattering).
- If a soil is flooded, another backscattering mechanism happens and it appears dark in the SAR image (specular reflection).

Water content and scattering mechanisms (© Humboldt State Univeristy, source)
Surface structure and roughness
- The backscattered signal depends also on the surface roughness.
- A surface is rough for a specific wavelength (cf. Parameter influencing SAR image – Sensor parameters – Wavelength).
- Different scattering mechanisms can be observed depending on the surface roughness.
- Rough surfaces show diffuse scattering. The amount of backscatter increases with surface’s roughness.
- Smooth surfaces show specular reflection: the signal is mirrored and nothing comes back to the sensor. Flooded areas appear dark in the SAR image.
- Corner reflections happen when the signal undergoes two subsequent specular reflections on perpendicular surfaces. It happens usually in urban areas, or at tree trucks in flooded vegetation areas. Almost all the incoming signal is scattered back to the sensor. It appears very bright in the SAR image.
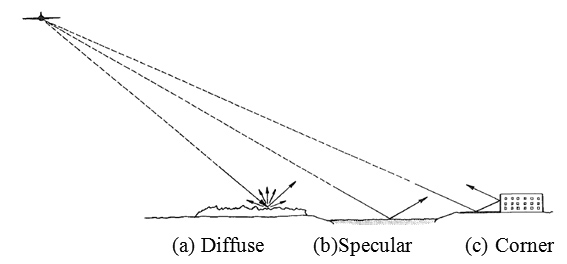
Surface roughness and scattering mechanisms (© Humboldt State Univeristy, source)
Learn more about how surface structure and roughness affect the SAR image in this paper (Meyer, 2019).
Local slope and orientation
Due to the side-looking acquisition geometry, the SAR image appears geometrically distorted.
SAR geometric distortions (© ESA, source)
Three distinct phenomena occurs in the SAR image of relief areas:
- Foreshortening areas appear bright in the SAR image. They occur on slope sides facing the sensor, when the terrain is inclined at a slope smaller than the incidence angle. The hillside appears “compressed” in the SAR image.
- Layover areas appear very bright in the SAR image. Layover occur on slopes facing the satellite sensor, when the terrain slope is larger than the incidence angle. The hillside appears “flipped” in the SAR image, as the signal from the top comes back to the sensor before the signal of the base.
- Shadow areas appear dark in the SAR image. They are situated behind a high feature and characterize areas that are not reached by the signal.
SAR backscatter from water
Mapping of water surfaces (waterbodies, wetlands, flooded areas) is based on different backscatter regimes of water surface and land surface.
- Calm water surfaces appear smooth and cause specular reflection leading to low backscatter.
- Surrounding land surface appears much rougher causing higher backscatter.

Difference in backscatter mechanisms for open water surfaces and dry land surfaces (after Solbø & Solheim, 2004)
SAR backscatter from flooded land
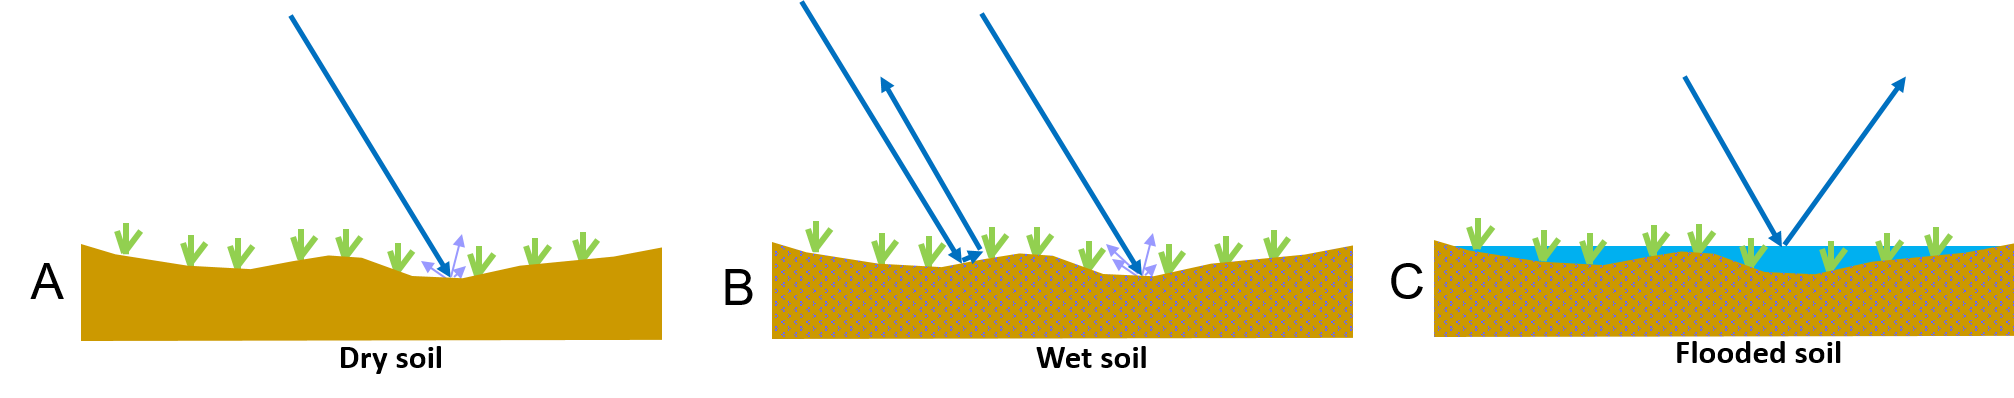
Changes in radar signal scattered back to the sensor from dry, wet and flooded soil (after Bourgeau-Chavez et al., 2009)
- A to B: First backscatter increases with increasing soil moisture.
- C: then with increasing water level, backscatter becomes weaker with more and more specular reflection (scattering away from the sensor).
Flood mapping: best practice
- One simple and common method for floods mapping is thresholding.
- Backscatter below threshold classified as flooded land
- Backscatter above threshold classified as dry land
- Thresholds derived from image histograms
- Results in binary mask (0 = land, 1 = water)
- Contrast between land and open water surface increases with increasing incidence angle.
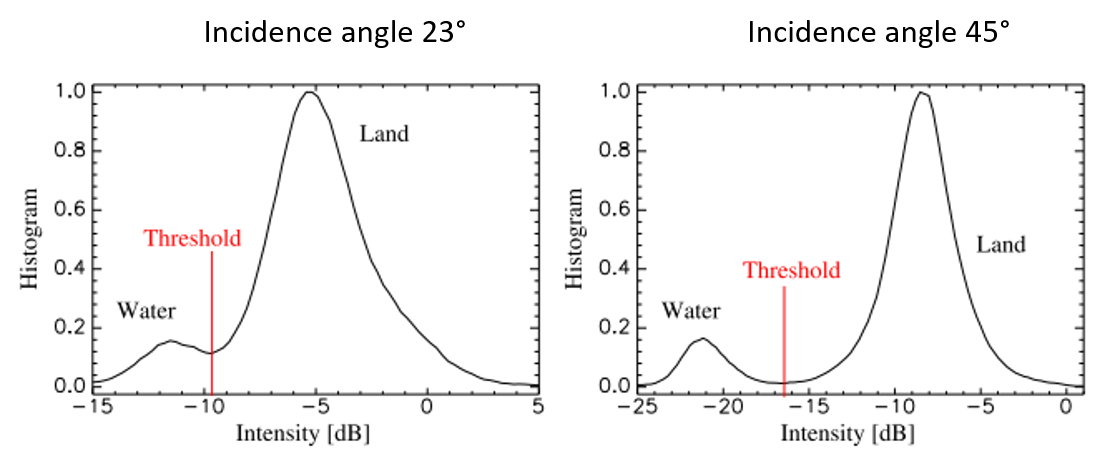
Histogram of two Radarsat SAR images of the same region acquired under different incidence angles (Solbø & Solheim, 2004)
Flood mapping: hands-on
(Source: ESA Echoes in Space - Hazard: Flood mapping with Sentinel-1)
In this tutorial you are going to learn how to generate a flood map from SAR images. You will use SNAP software to process two Sentinel-1 images of Myanmar.
Reference list
Bourgeau-Chavez, L.L, Riordan, K., Powell, R.B., Miller, N., Nowels, M. (2009). Improving Wetland Characterization with Multi-Sensor, Multi-Temporal SAR and Optical/Infrared Data Fusion, Advances in Geoscience and Remote Sensing, Gary Jedlovec (Ed.), InTech; ISBN: 978-953-307-005-6, DOI: 10.5772/8327
EO College materials:
- Pathe, C. (2015). Hydrosphere. An Introduction; Availabe at: Link
- Pathe, C. (2015). Hydrosphere Applications – Wetlands, Waterbodies, Floods, Precipitation & River Velocity; Availabe at: Link
- ESA (2017). Echoes in space. Introduction to Radar Remote Sensing; Available at: Link
Jensen, J.R. (2000). Remote Sensing of the Environment: An Earth Resource Perspective. Prentice Hall, Saddle River.
Meyer, F. (2019). Spaceborne Synthetic Aperture Radar: Principles, data access, and basic processing techniques. Synthetic Aperture Radar (SAR) Handbook: Comprehensive Methodologies for Forest Monitoring and Biomass Estimation; Available at: Link
Ouchi, K. (2013). Recent Trend and Advance of Synthetic Aperture Radar with Selected Topics, Remote Sensing 2013, 5(2), 716-807; DOI 10.3390/rs5020716
Serway, R. A., Beichner, R. J., & Jewett, J. W. (1999). Physics for Scientists and Engineers with Modern Physics (5th edition). Orlando: Saunders College Publishing.
Solbø S. & Solheim, I. (2004). Towards operational flood mapping with satellite SAR, ENVISAT/ERS Symposium, Salzburg, Sep. 2004.
Podest, E. (2018). SAR for Flood Mapping. NASA's Applied Remote Sensing Training Program; Available at: Link