Sentinel-2 Data and Vegetation Indices
Learning outcomes
- Learn the principle of the spectral index calculation
- Familiarize with different vegetation spectral indices
- Get to know the Sentinel-2 spectral bands
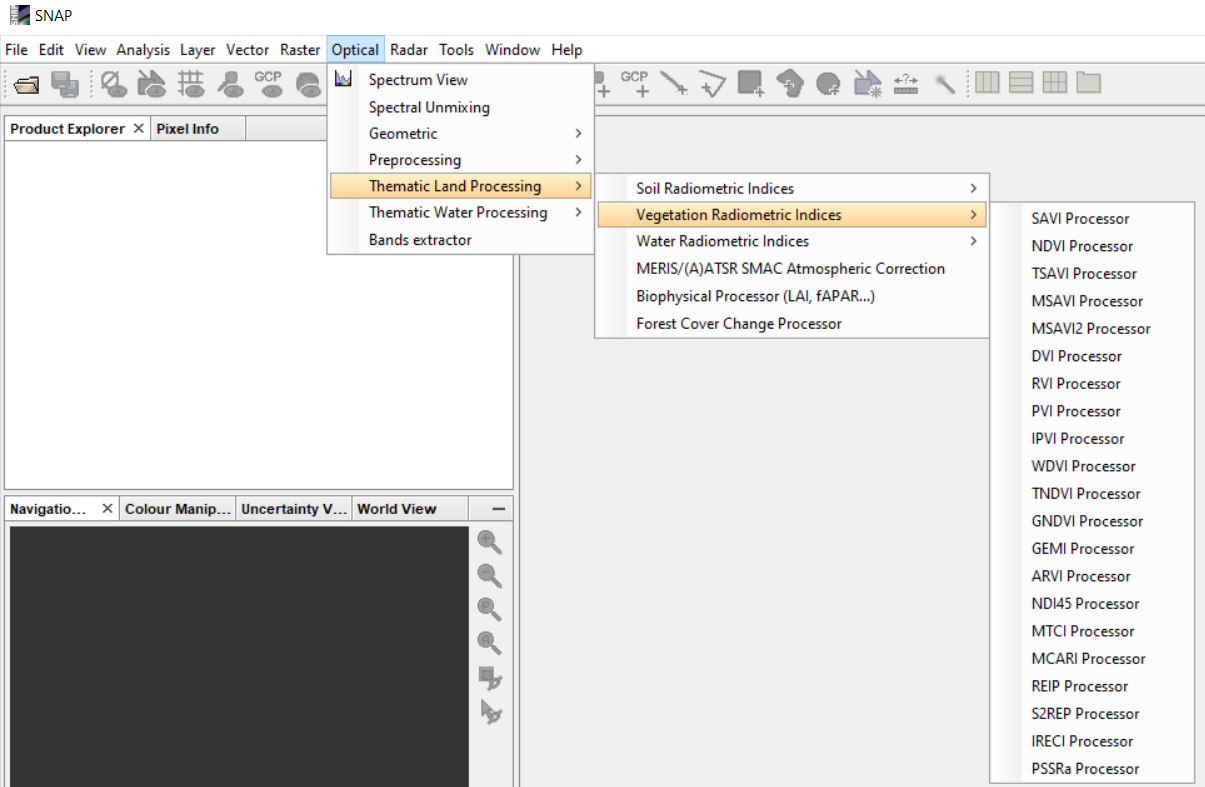
- Learn about the index database and tools available to calculate indices
- Learn how the spectral indices are used in different applications: agriculture, forestry, vineyards, natural hazards: fires, windstorms
BoK Concepts
- [IP3-1-2] Spectral indices
- [[PP1-3-4] Spectral Signature of Vegetation, Water, Soil
- [PP1-1] EM radiation
Module 1
Introduction to spectral indices
Spectral Indices Background
Spectral indices are used to enhance particular land surface features or properties, e.g. vegetation, soil, water.
There are developed based on the spectral properties of the object of interest.
Spectral Indices Background
Spectral signatures of clean/turbid water (in reflectance)
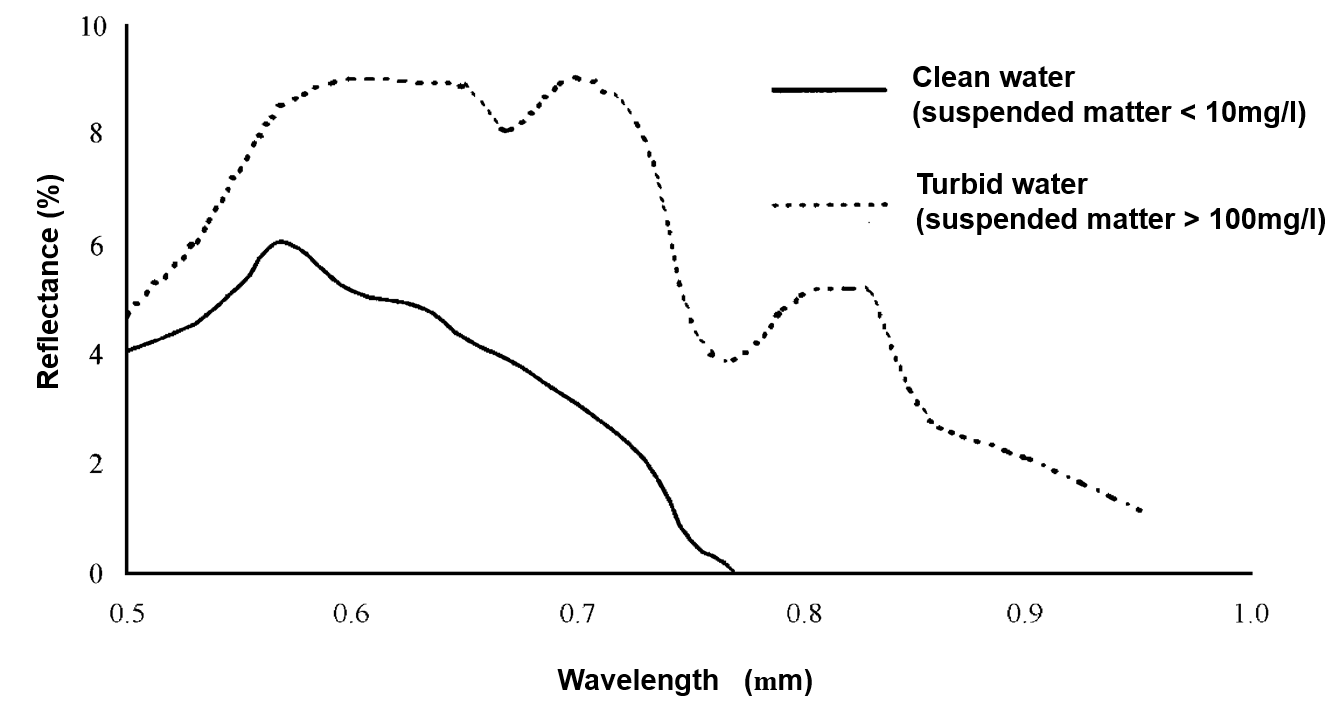
Source: Ma, M., et al. (2007) Change in area of Ebinur Lake during the 1998–2005 period. International Journal of Remote Sensing, 28(24), 5523-5533.
Spectral Indices Background
Spectral signatures of snow and clouds (in reflectance)
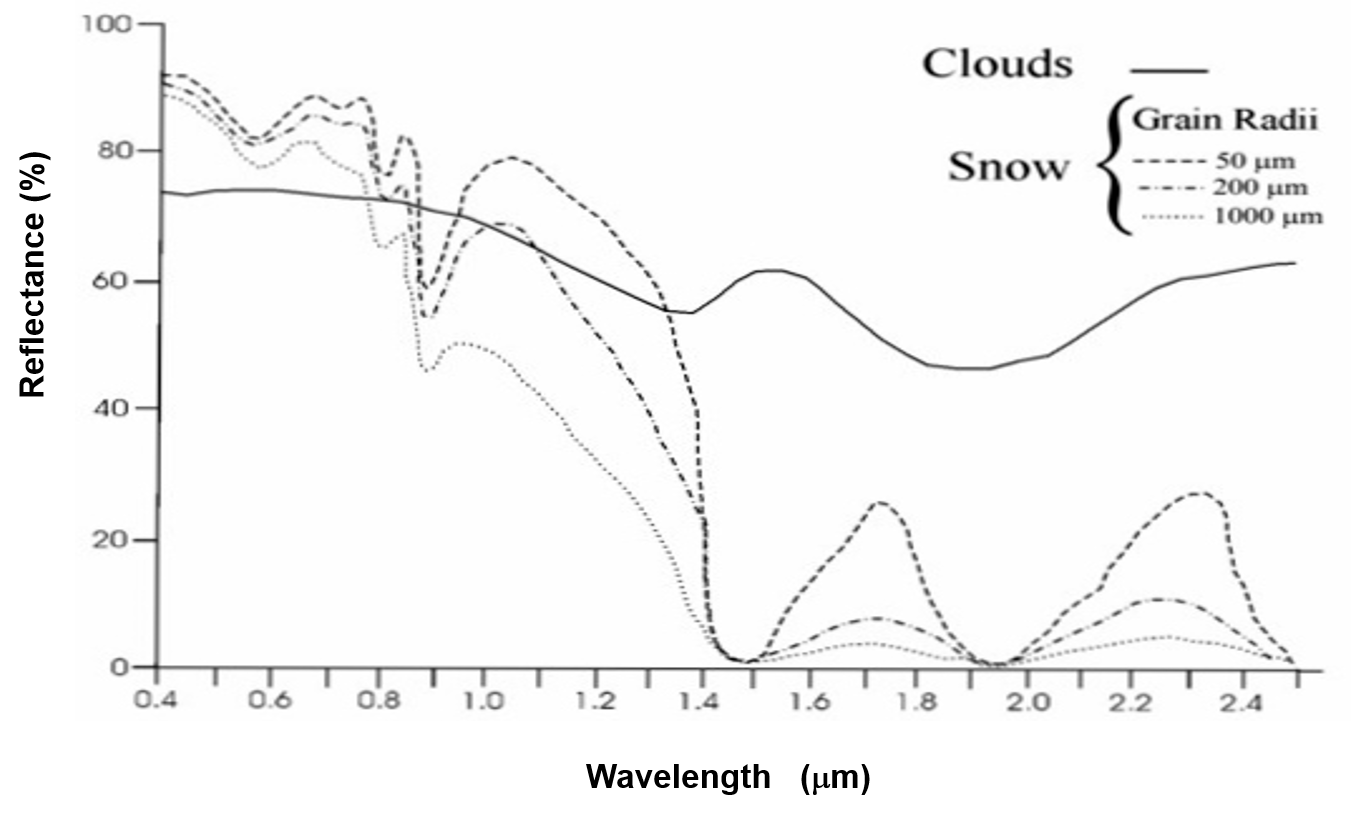
Source: Dong, C. (2018) Remote sensing, hydrological modelling and in situ observations in snow cover research: A review. Journal of Hydrology, 561, 573-583.
Spectral Vegetation Principles
Knowledge of the leaf cell, plant structure, status, condition and its spectral properties is essential to perform the vegetation analysis using remote sensed data.
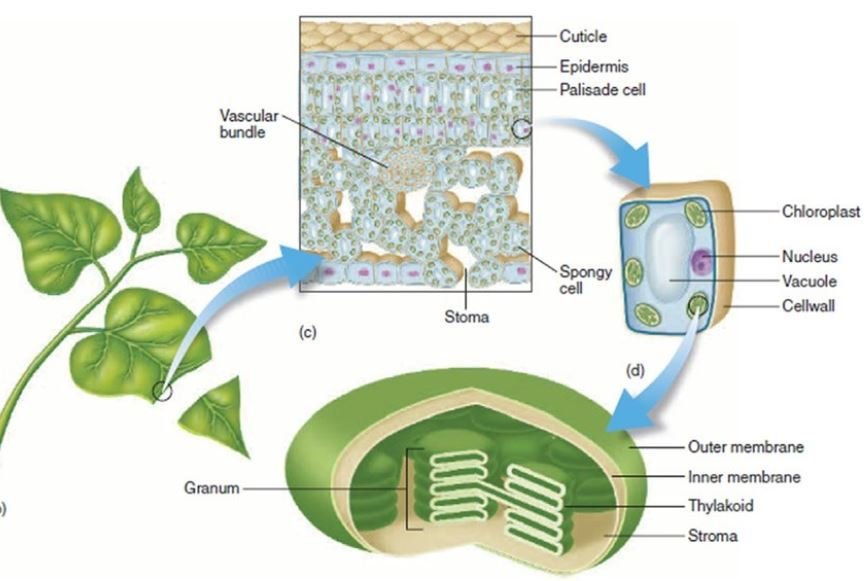
The structure of a chloroplast, and its location within a plant cell and leaf.
Source: Levetin and McMahon (2008)Spectral Vegetation Signatures
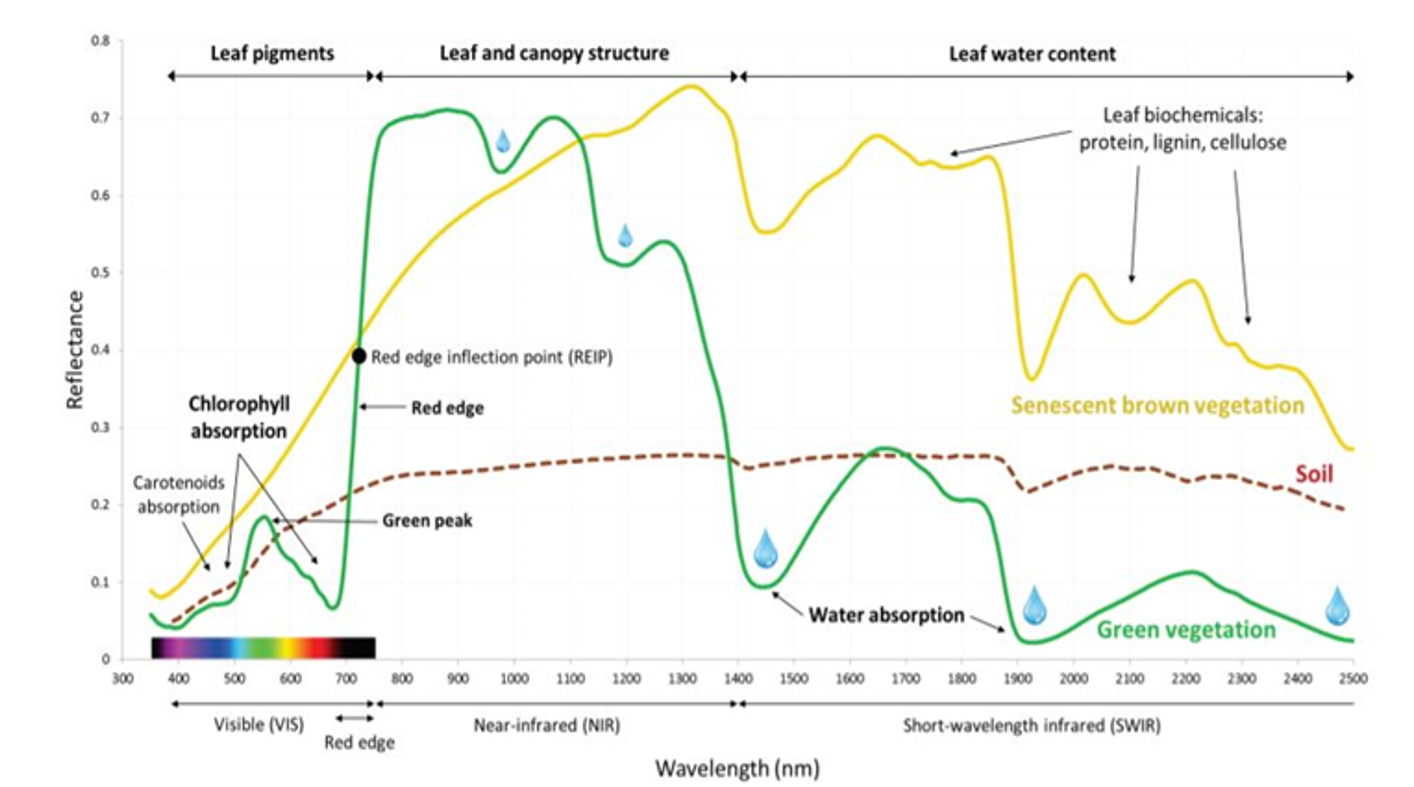
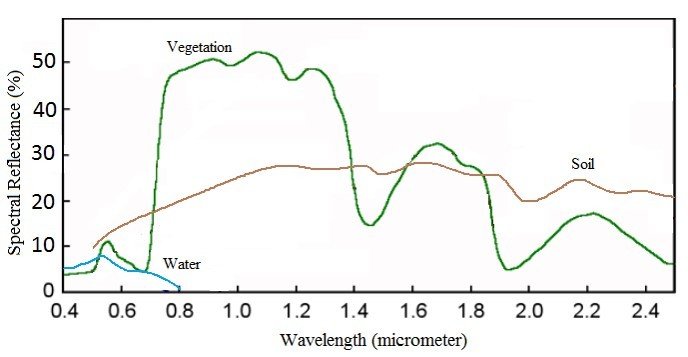
Dominant factor controlling leaf reflectance.
Vegetation spectra correspond to bundles of leaves and steams of Spartina alternifora, a wetland perennial grass from Kokaly et al. (2017), Soil spectrum from Clark (1999). Figure adapted by Denis, A. (2018) from Kokaly et al. (1998), Bowker et al. (1985), Curran (1989) and Thenkabail et al. (2013)Spectral Vegetation Signatures
|
|
Spectral Vegetation Signatures
Monitoring vegetation disease
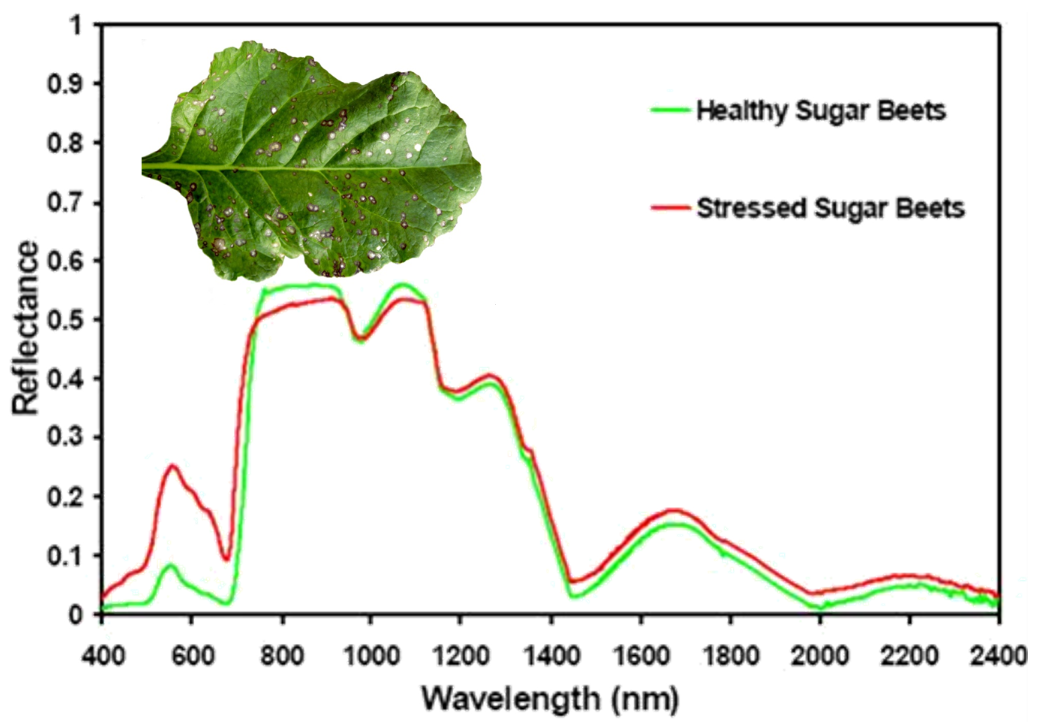
Source: Ashraf, M. A., Maah, M. J., & Yusoff, I., (2011) Introduction to remote sensing of biomass. In Biomass and remote sensing of biomass, 129-170. IntechOpen.
Vegetation indices
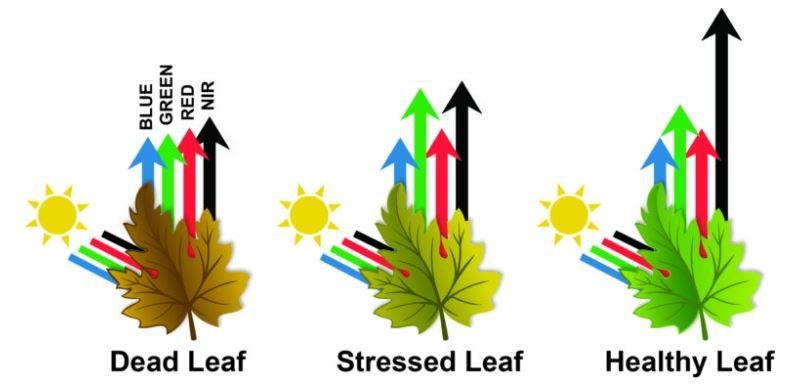
Spectral indices dedicated to vegetation analysis are developed based on the principle that the healthy vegetation reflects strongly in the near-infrared (NIR) spectrum while absorbing strongly in the visible red.
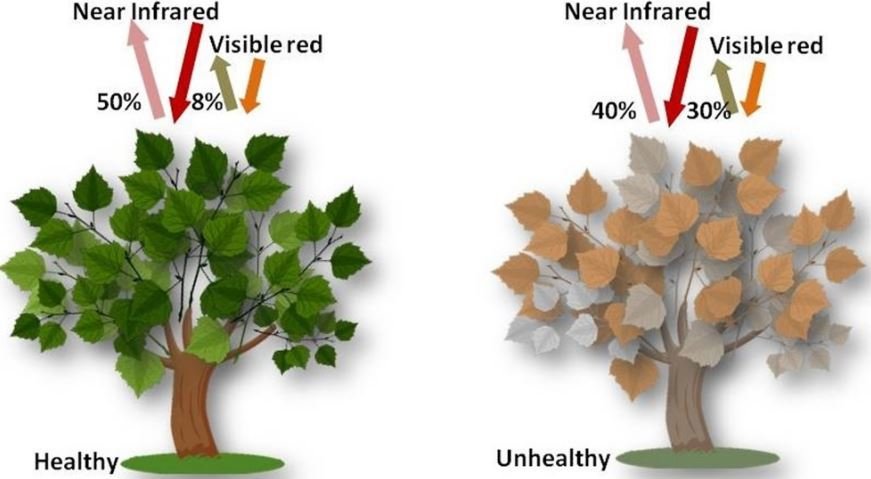
Source: Wu Ch-D., et al. (2014)
Rational for Vegetation Indices
To explore and highlight the unique spectral signatures of vegetation, which allows to delineate it from the other earth objects.
To delineate the subtle changes in the spectral signatures of vegetation caused by changes in plant vigour and health that cannot be distinguished by human eye.
Spectral vegetation indices have been found to be related to various biophysical parameters, i.e. Leaf Area Index (LAI), percent vegetation cover, fraction of absorbed photosynthetically active radiation (fAPAR), photosynthetic capacity, and carbon dioxide fluxes.
How to calculate spectral indices?
There are calculated using a mathematical equation applied to two or more wavelengths across the optical spectrum.
Spectral indices varied from a simple spectral rationing to more complicated combination of multispectral bands.
They are used to combine the multiple spectral bands into a single image, which highlights particular land surface features or properties.
Sentinel-2 Spectral Bands
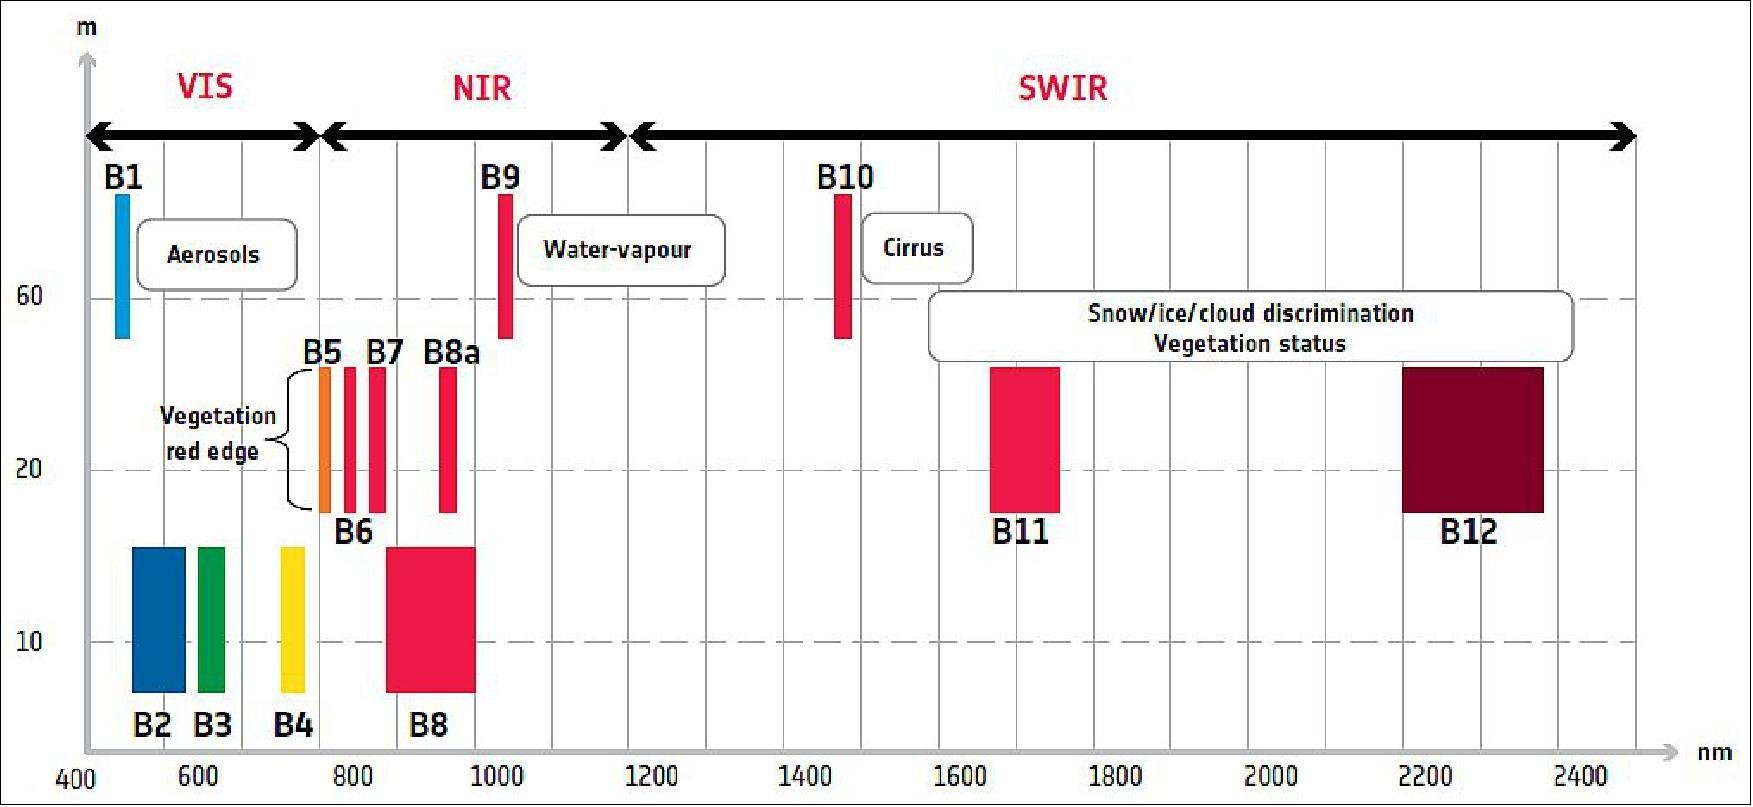
Sentinel-2 spectral characteristics, © ESA
Simple band ratio
A common practice in remote sensing is the use of band ratio to eliminate various effects such as:
Example of simple ratio index:
RVI - Ratio Vegetation Index
RVI = (NIR / Red)
For Sentinel-2 the formula is: B8 / B4, where: B8 = 842 nm, B4 = 665 nm
Simple band ratio
Examples:
PSSRa - Pigment Specific Simple Ratio (chlorophyll index) algorithm (Blackburn, 1998) investigates the potential of a range of spectral approaches for quantifying pigments at the scale of the whole plant canopy.
PSSRa = (NIR) / (Red)
For Sentinel-2 the formula is: B7 / B4, where: B7 = 783 nm, B4 = 665 nm
Combination of multispectral bands
NDVI - Normalized Difference Vegetation Index
|
Effective for quantifying green vegetation. Positively correlated with vegetation greenness.
NDVI range value is -1 to 1 |
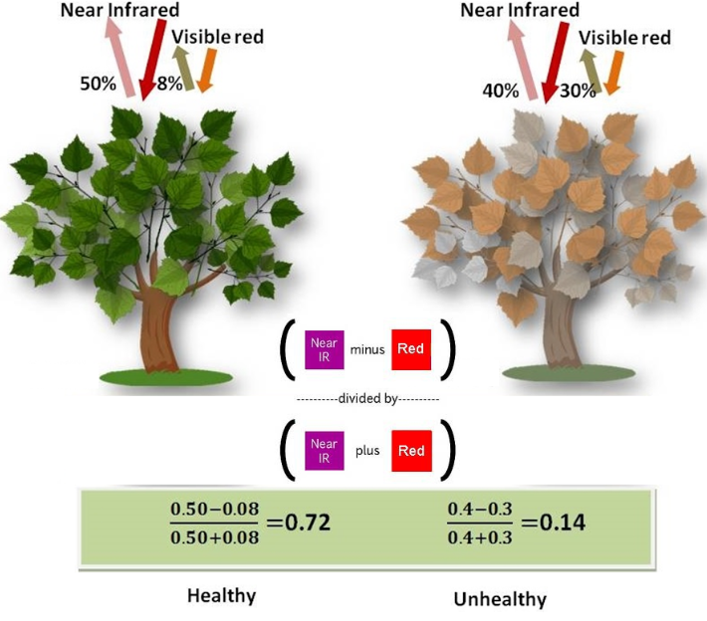
Source: Wu Ch-D., et al. (2014) |
Examples of the NDVI related indices
TNDVI - Transformed Normalized Difference Vegetation Index, indicates a relation between the amount of green biomass that is found in a pixel. It has always positive values and the variances of the ratio are proportional to mean values (Senseman et al. 1996).
TNDVI = (sqrt(NDVI + 0.5))
NDI45M - Normalized Difference Index (Delegido et al. 2011), is more linear, with less saturation at higher values than the NDVI
NDI45 = (NIR – R) / (NIR + R)
For Sentinel-2 the formula is: (B5 - B4) / (B5 + B4), where: B5 = 705 nm, B4 = 665 nm
Examples of the NDVI related indices
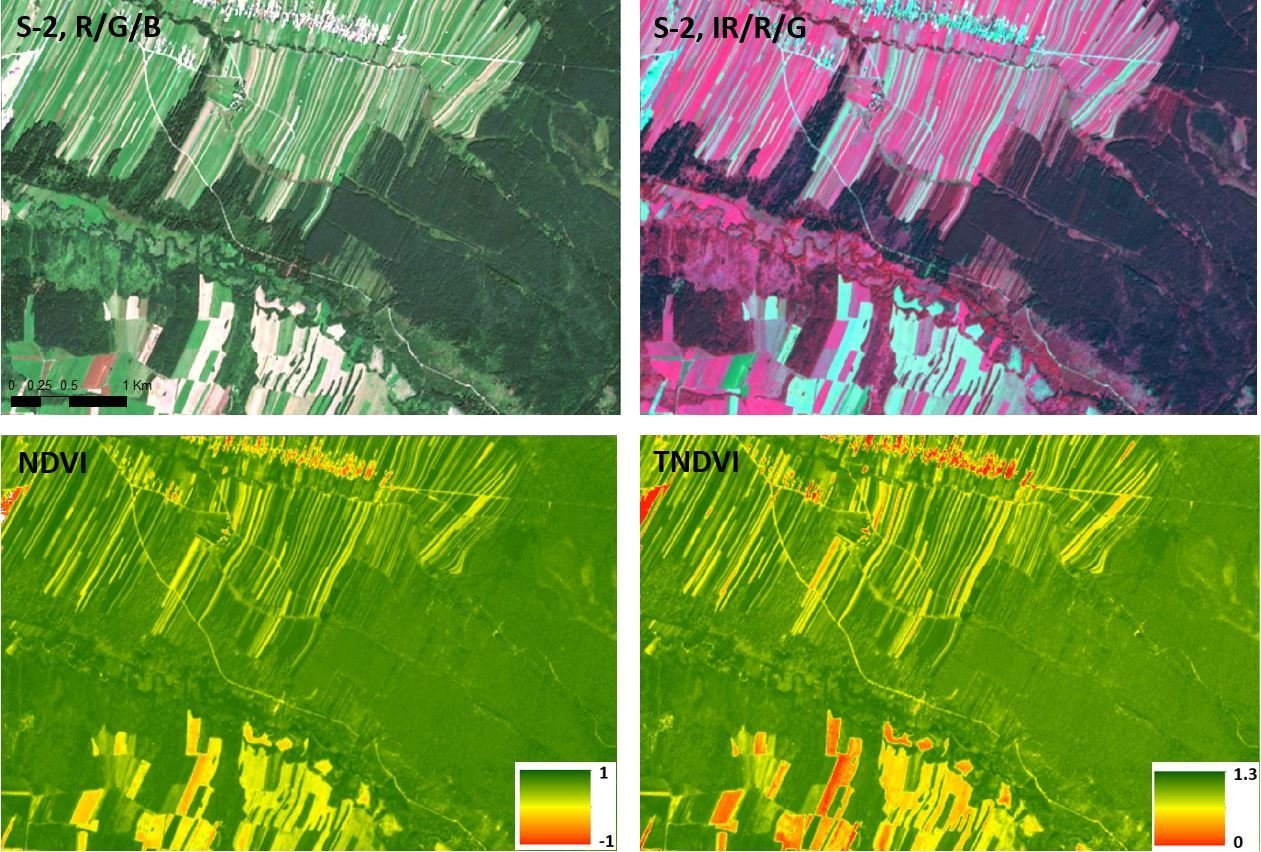
NDVI and TNDVI calculated based on Sentinel-2 data © IGIK
Indices with green wavelength
Green spectral band was found to be more efficient than the red spectral band to discriminate nitrogen.
GNDVI - Green Normalized Difference Vegetation Index (Gitelson et al. 1996) is more sensitive than NDVI to different concentration rates of chlorophyll, which is highly correlated at nitrogen.
GNDVI = NIR - Green / NIR + Green
Indices with green wavelength
MCARI - Modified Chlorophyll Absorption Ratio Index - is responsive to both leaf chlorophyll concentrations and ground reflectance.
MCARI = ((Red2 - Red1) - 0.2 * (Red2 - Green)) * (Red2 / Red1)
For Sentinel-2 the formula is:
[(B5 - B4) - 0.2 * (B5 - B3)] * (B5 - B4),
where: B5 = 705 nm, B4 = 665 nm, B3 = 560 nm
Indices with red-edge wavelengths
The 'red edge' is the name given to the abrupt reflectance change in the 680 ± 740 nm region of vegetation spectra that is caused by the combined effects of strong chlorophyll absorption and leaf internal scattering.
Red edge, as the inflection point of the strong red absorption to near infrared reflectance, includes the information of chlorophyll content, nitrogen and growth status.
Indices with red-edge wavelengths
S2REP - Sentinel-2 Red-Edge Position Index is sensitive to both crop (chlorophyll content) N and growth status. Generally, the higher the S2REP value, the higher is the chlorophyll content (Guyot and Baret, 1988). The Sentinel-2 Band 6 (740 nm) measures the reflectance situated at the top of the linear part of the 'red edge' slope.
S2REP = 705 + 35 * ((Red1 + NIR)/2) - Red2 / (Red3 - Red2))
For Sentinel-2 the formula is:
705 + 35 * ((B4 + B7)/2) - B5 / (B6 - B5)),
where: B7 = 783 nm, B6 = 740 nm, B5 = 705 nm, B4 = 665 nm
Indices with red-edge wavelengths
IRECI - Inverted Red-Edge Chlorophyll Index algorithm incorporates the reflectance in four bands to estimate canopy chlorophyll content (Guyot and Baret, 1988; Clevers et al., 2000).
IRECI = (NIR - Red1) / (Red2 / Red3)
For Sentinel-2 the formula is:
(B7 - B4) / (B5 / B6),
where: B7 = 783 nm, B6 = 740 nm, B5 = 705 nm,
B4 = 665 nm
Vegetation Indices Issues
Indices dedicated to reduction of soil noise
Indices dedicated to reduction of soil noise
SAVI - Soil Adjusted Vegetation Index - use a transformation technique that minimizes soil brightness influences from spectral vegetation indices involving red and near-infrared (NIR) wavelengths.
SAVI = (1+L) * (NIR - Red) / (NIR + Red + L)
For Sentinel-2 the formula is:
(B08 - B04) / (B08 + B04 + L) * (1.0 + L); L = 0.428
where: L is a soil brightness correction factor ranging from 0 to 1
L = 1 low vegetation cover, L = 0 high vegetation cover, L = 0.5 intermediate vegetation cover.
Indices dedicated to reduction of soil noise
Sentinel-2 - SAVI
https://custom-scripts.sentinel-hub.com/custom-scripts/sentinel-2/savi/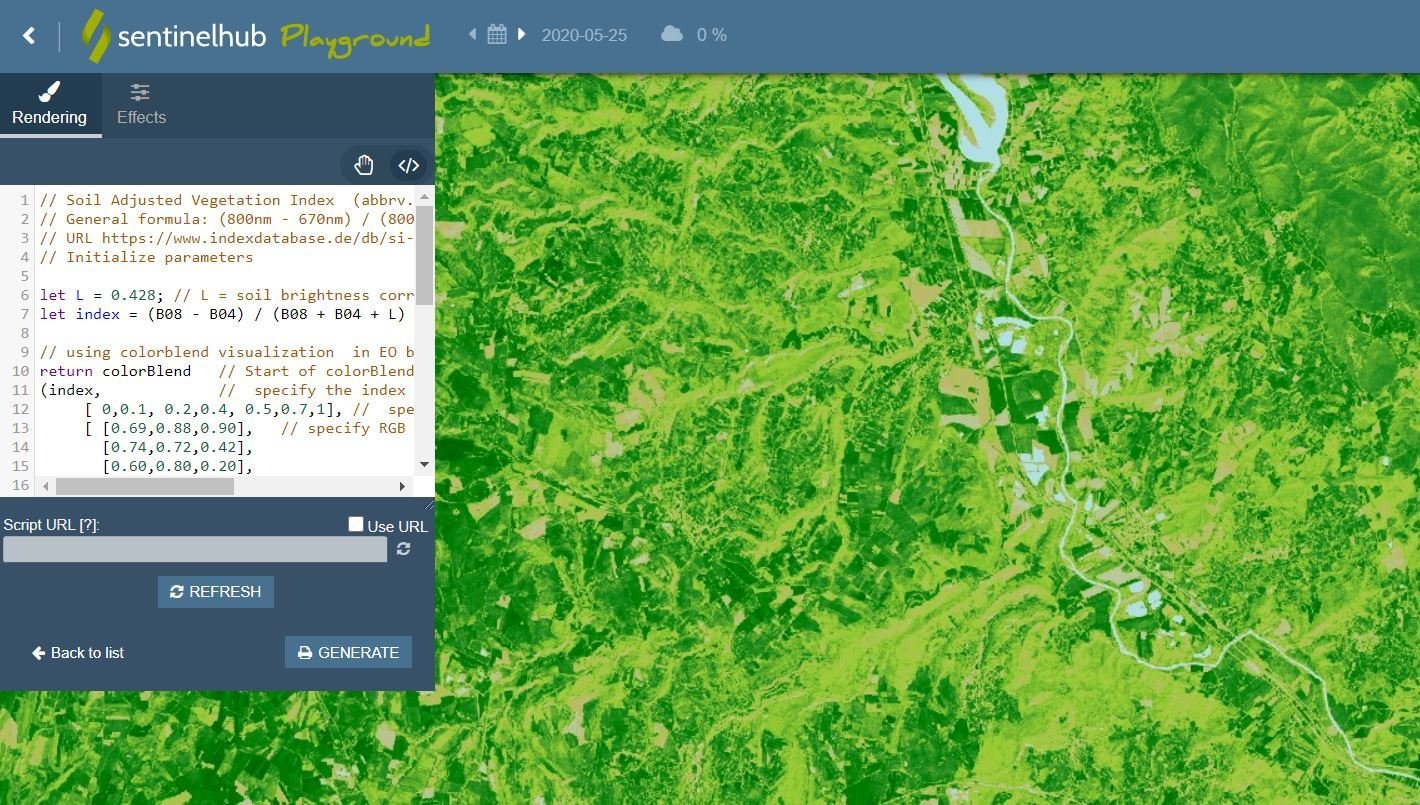
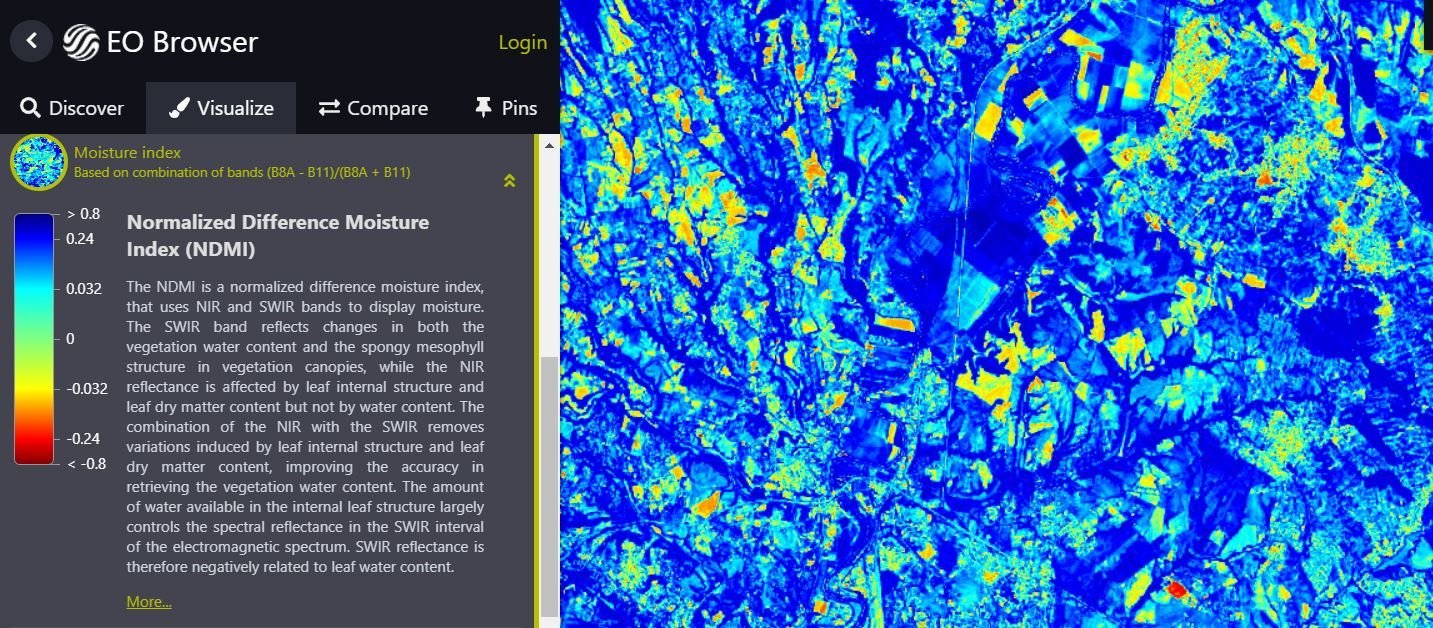
Vegetation Moisture Sensitive Indices
The moisture sensitive indices are calculated using SWIR and NIR.
The SWIR bands are sensitive to vegetation water content and spongy mesophyll structure in the vegetation canopy. The NIR reflectance is affected by leaf internal structure and leaf dry matter content but not by water content.
There are used to assess the vegetation moisture decline that is particularly useful for drought monitoring.
There are widely applied in agricultural and ecological applications including surface water body characteristics, vegetation water stress, soil water content assessment and wetlands monitoring.
Vegetation Moisture Sensitive Indices
NDMI - Normalized Difference Moisture Index (Gao, 1995).
.
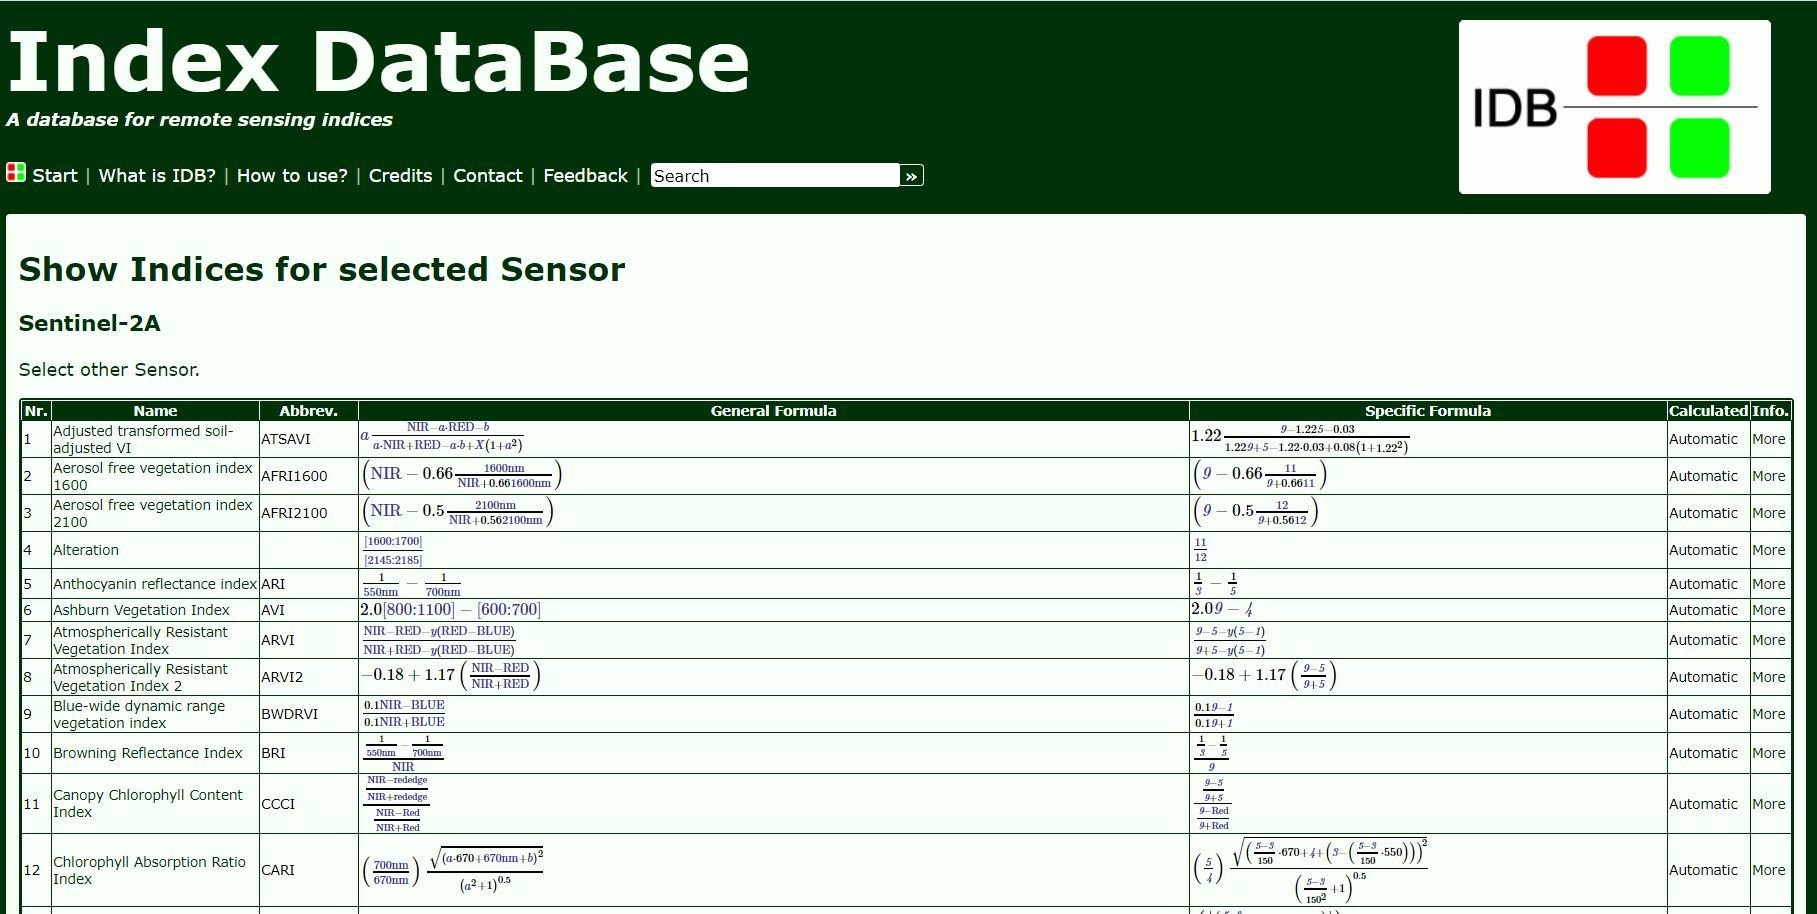
Index Database
! 249 spectral indices available !
https://www.indexdatabase.de/db/is.php?sensor_id=96.
Sentinel-2 Indices
|
Large collection of Sentinel-2 spectral indices and Java scripts available on https://custom-scripts.sentinel-hub.com/custom-scripts/sentinel-2/indexdb/ |
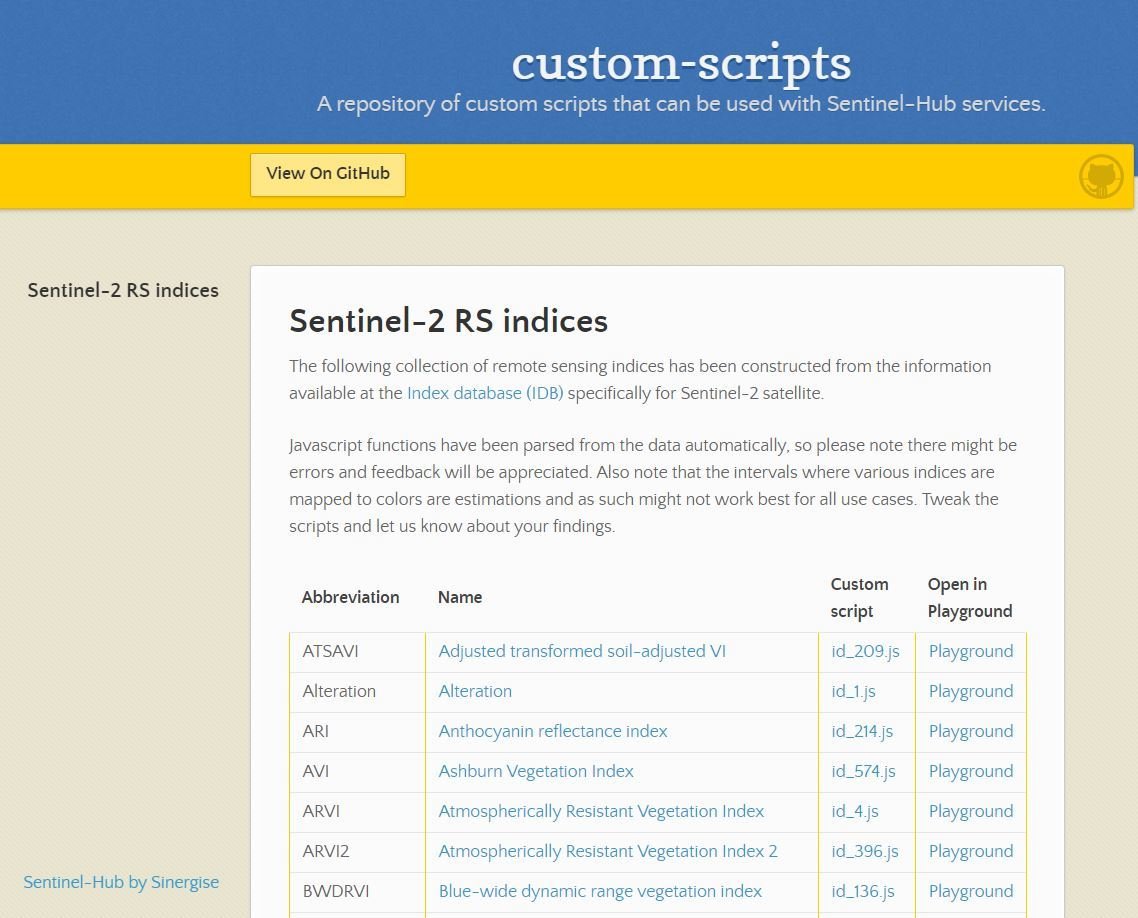
|
Sentinel-2 Indices
Module 2
Application of vegetation spectral indicess
Agriculture
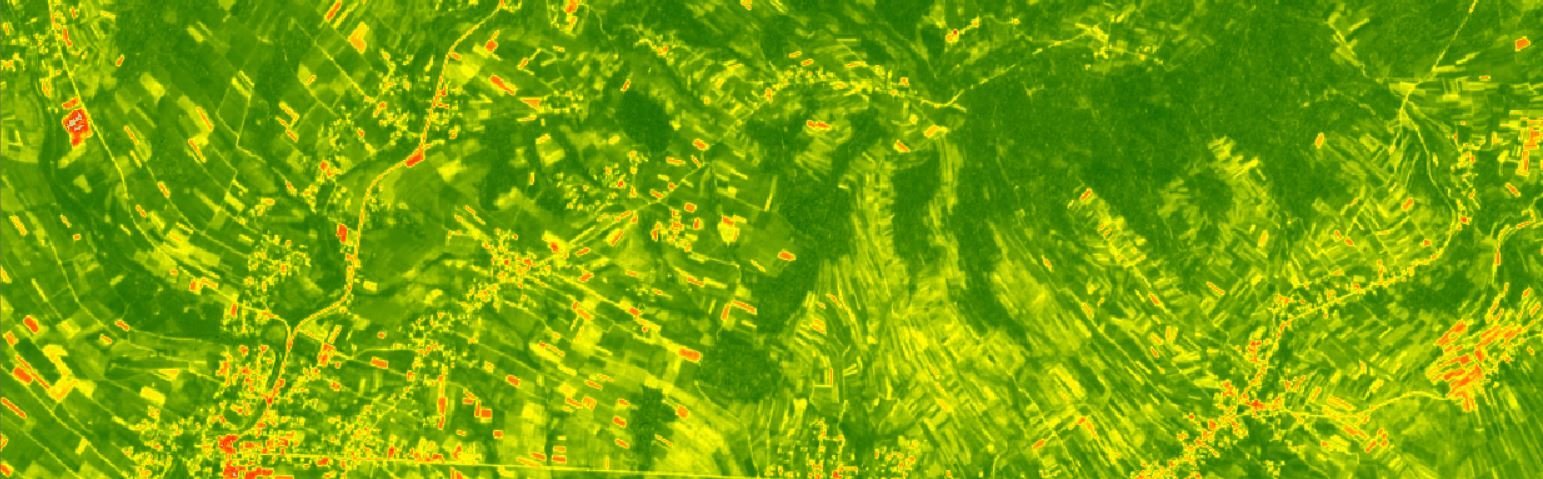
Analysing the crop health and vigour
|
Variation of maize condition depending on drought conditions. The condition of maize, expressed by the vegetation index - NDVI, calculated using Sentinel-2 data compared with the maps of agricultural droughts for the same decades of the year, calculated on the basis of NOAA AVHRR data. |
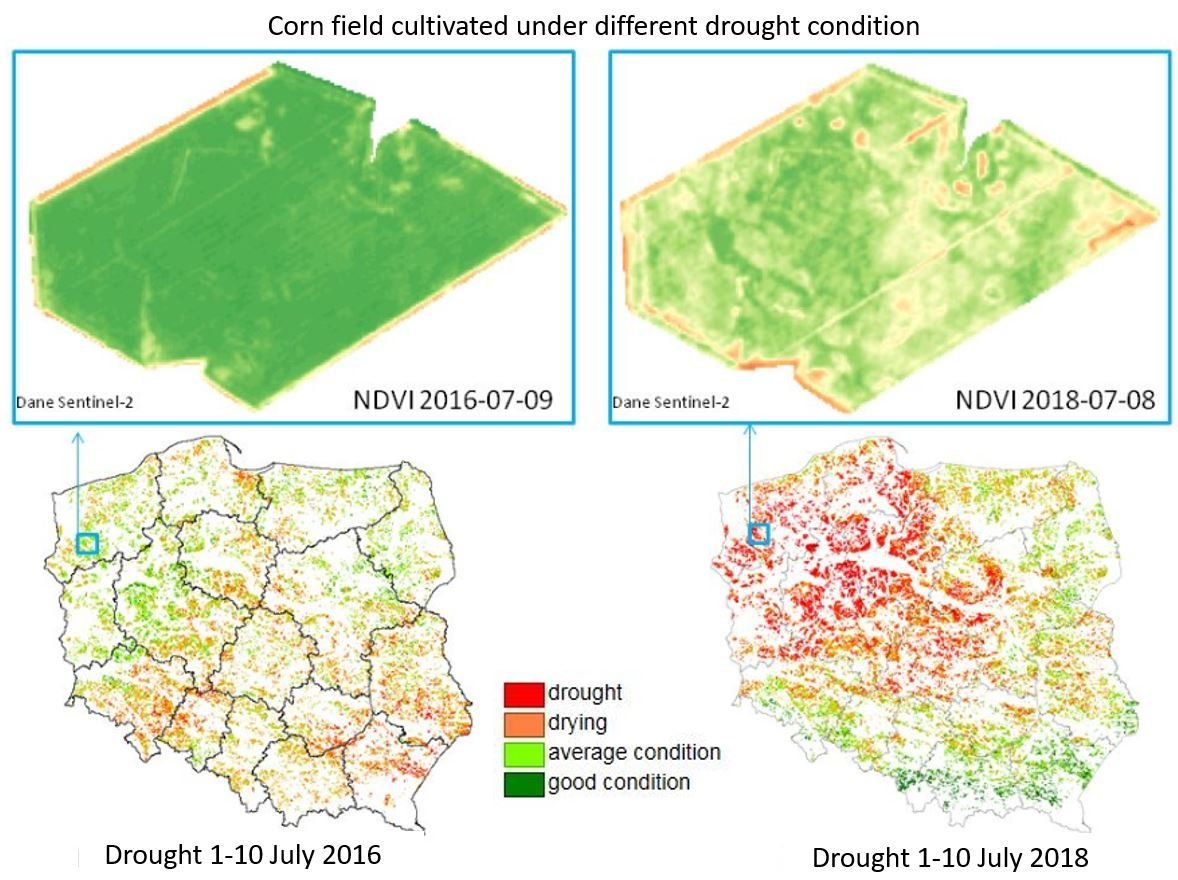
© IGIK |
Agriculture
Using multi-temporal vegetation indices can help management of individual fields during the growing season. They can also be used for within-field monitoring of growth and application of fertilizers.
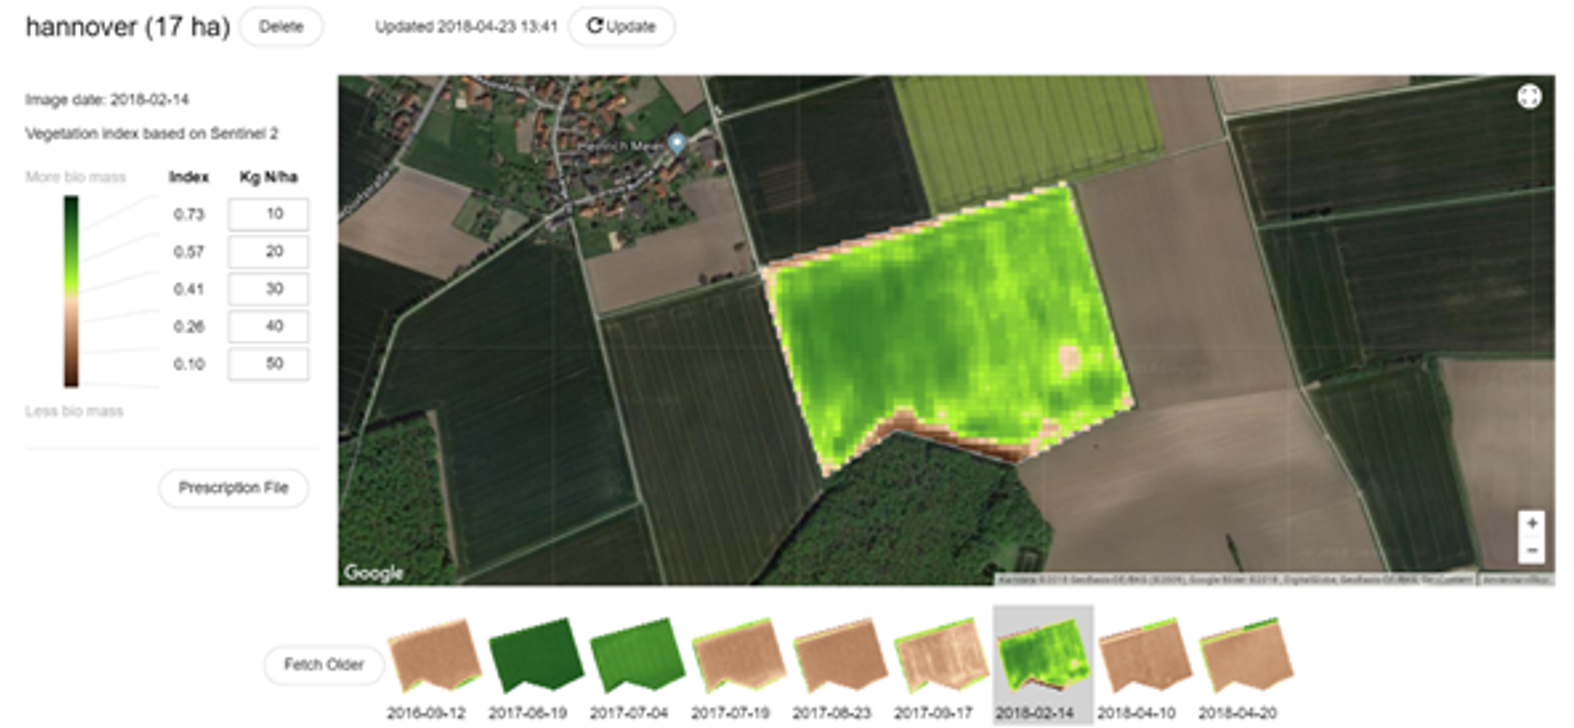 © Geografiska informationsbyrån
Forestry
Analysing the crop health and vigour
|
Forest health and condition Combination of different spectral Spectral-2 indices (NDVI, NDMI and PSSRa) allows to assess and monitor forest health condition over time. |
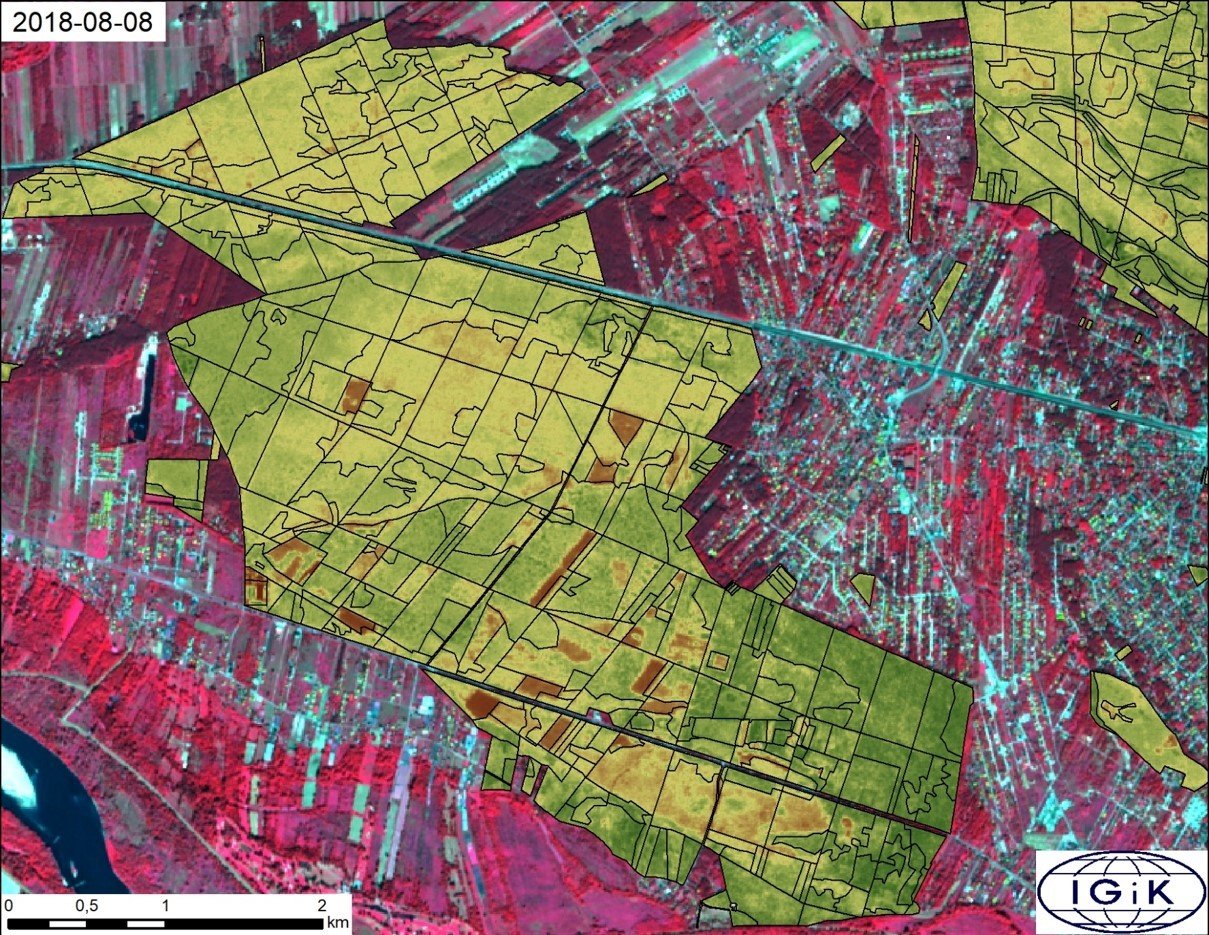
© IGIK |
Forestry
Multi-temporal Sentinel-2 vegetation indices are applied to monitor bark beetle outbreak in Białowieża National Park - Poland
|
DSWI - Disease Water Stress Index sensitive to stress due to water shortage and plant damage DSWI = (NIR-GREEN) / (SWIR1 + RED) |
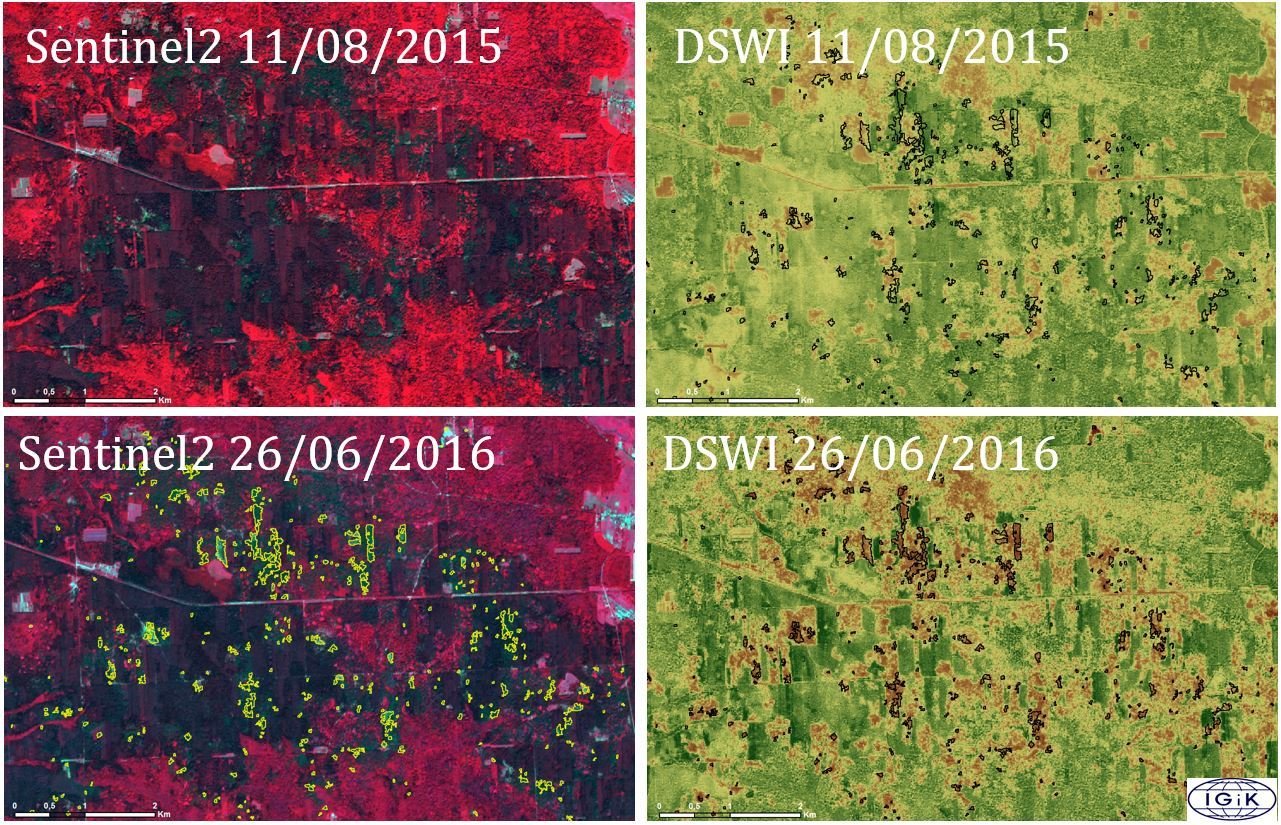
Source: Hoscilo et al. (2016) |
Vineyards
|
Monitoring condition of vineyards using NDVI (April-September 2019) Vineyards Srebrna Góra, Poland Sentinel-2 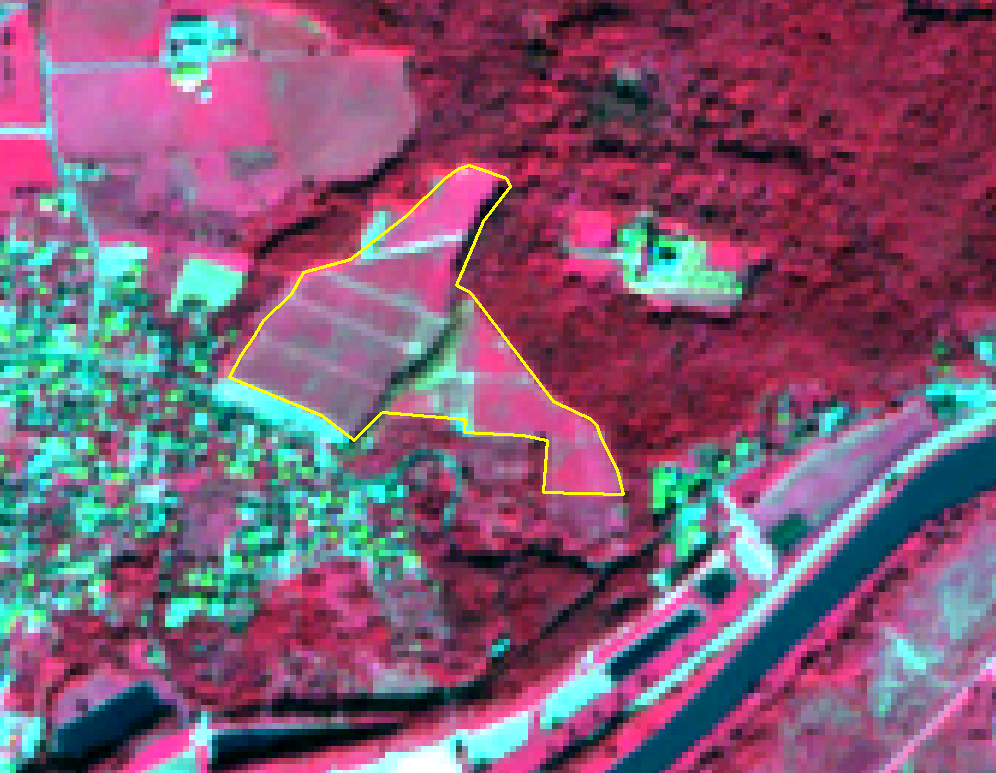
|
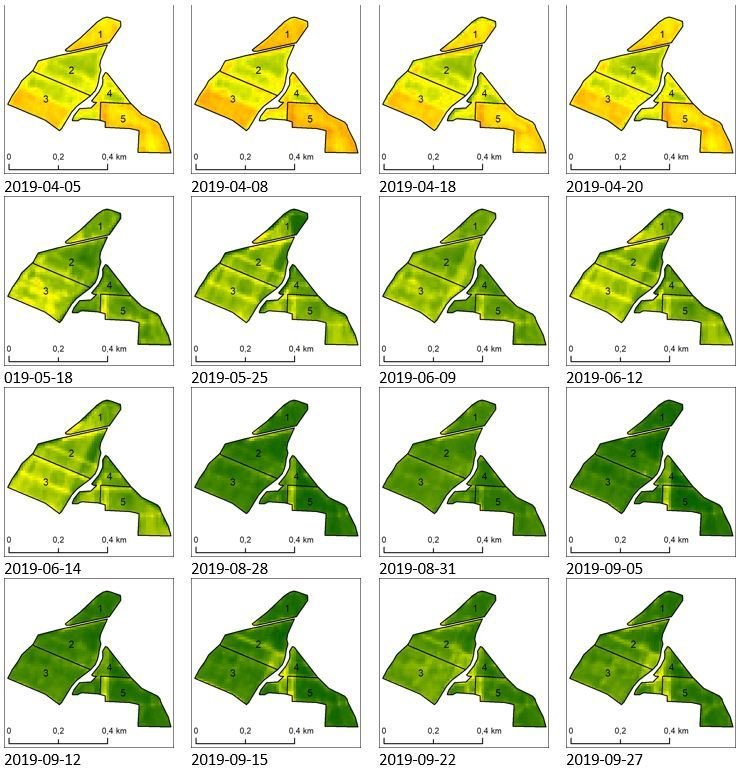 © IGIK & VINUM 4.0 Sp z o.o
|
Vineyards
|
Monitoring condition of vineyards using Sentinel-2 moisture index (NDMI) (April-September 2019) Vineyards Srebrna Góra, Poland
NDMI
|
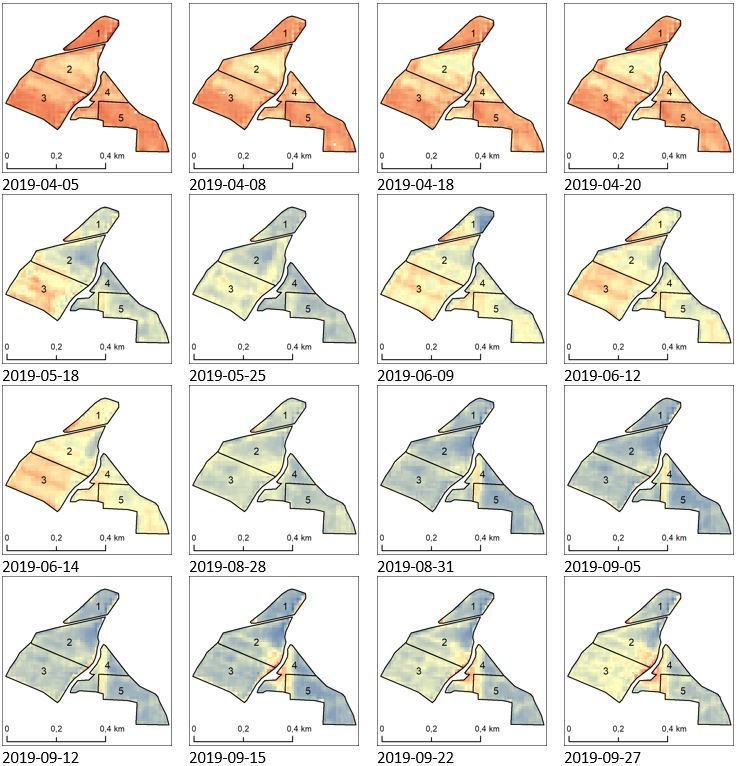
© IGIK & VINUM 4.0 Sp z o.o. |
Natural hazards - Fire
|
Mapping burnt areas with Normalized Burnt Ratio index (NBR). Example from forest fire 2014 in Sala, Sweden. Sentinel-2 image 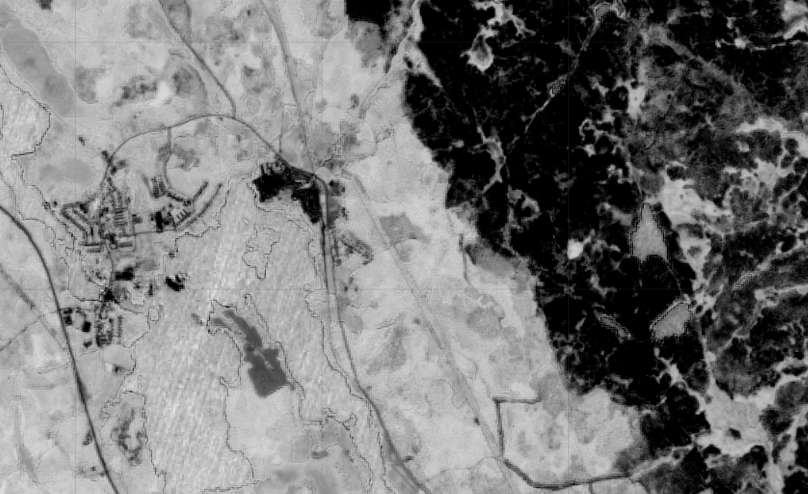
|
© Geografiska informationsbyrån |
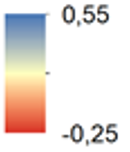
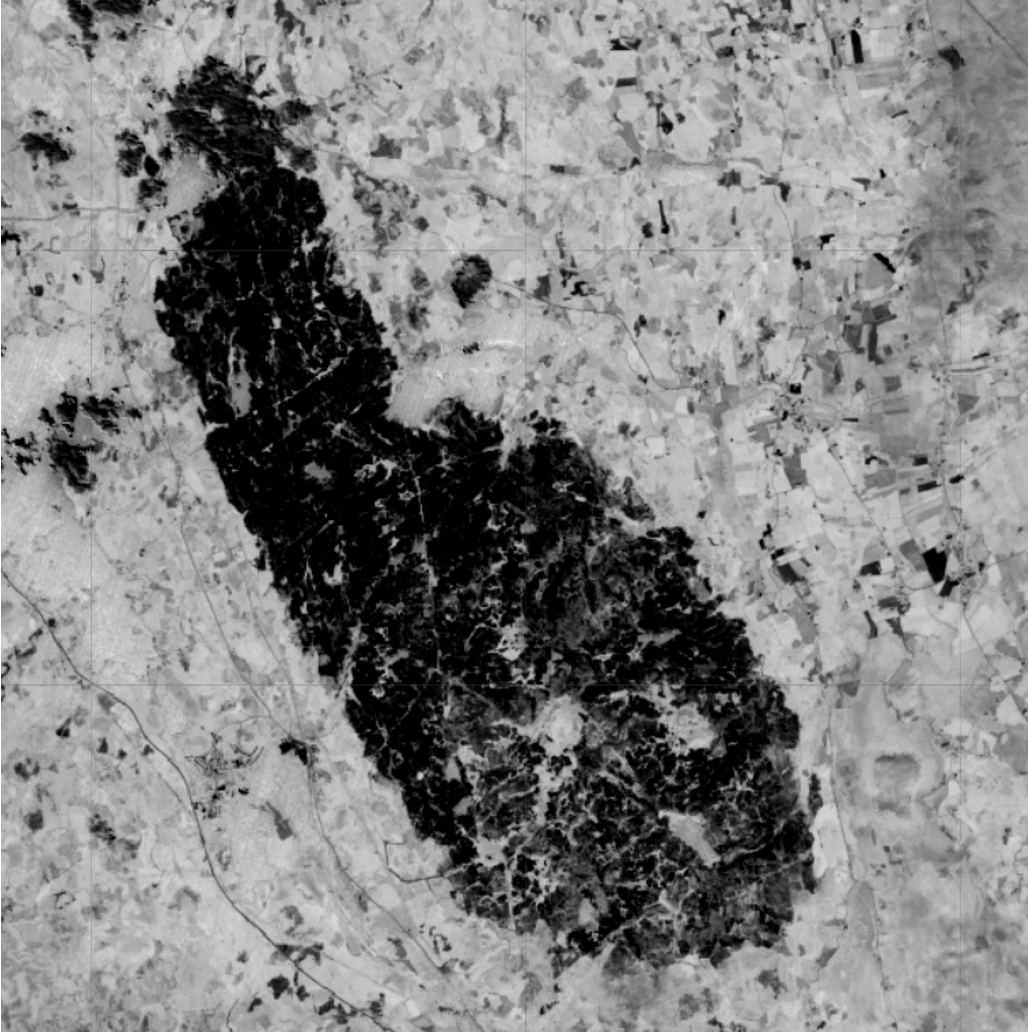
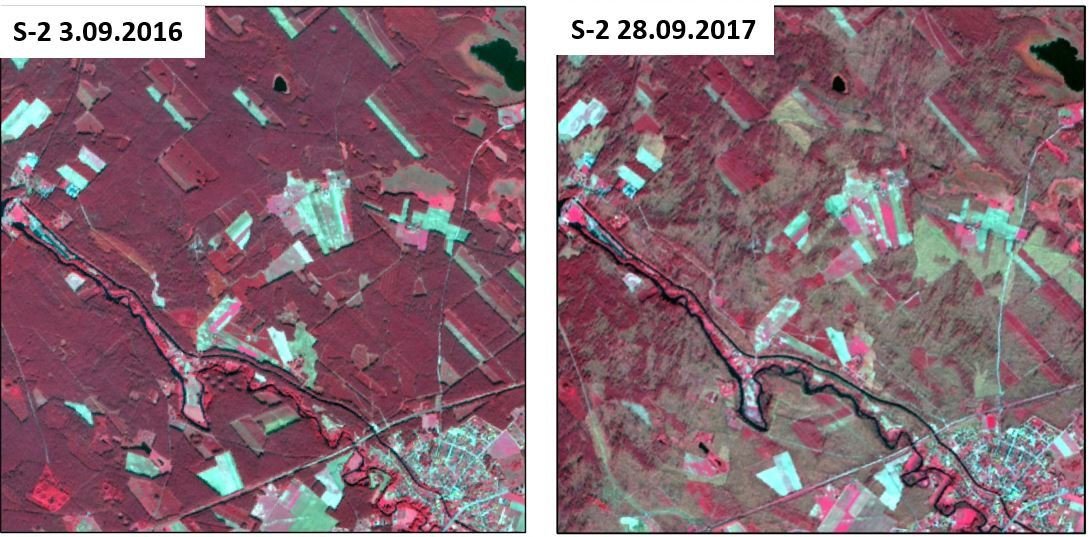
Natural hazards - Windstorm
|
Assessment of forest damage caused by the windstorm 11-12 August 2017 in Poland, using Sentinel-2
NDMI - Normalized Difference Moisture Index
|
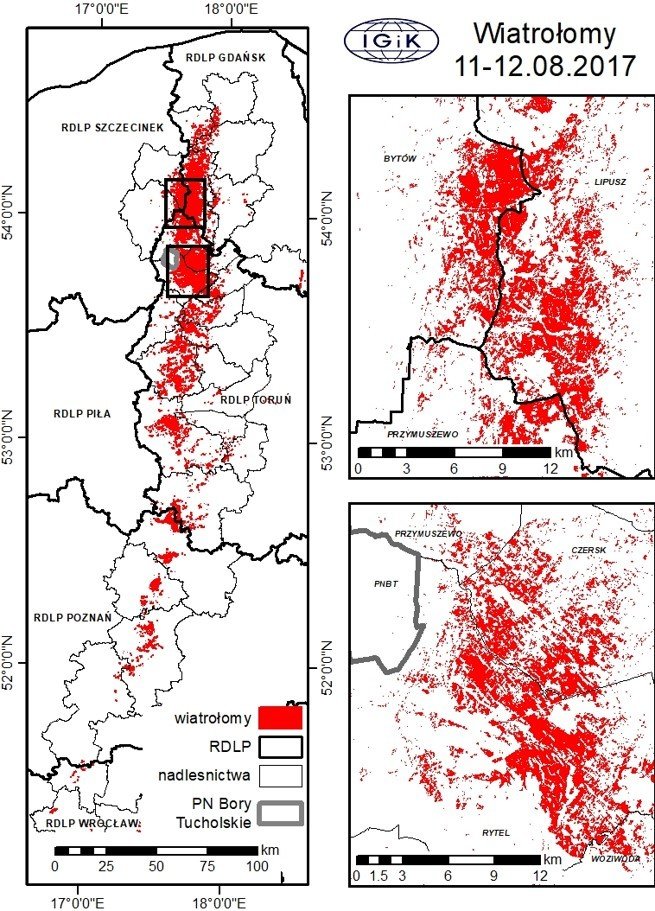 Source: Hoscilo and Lewandowska (2018)
|