Impact Modelling
Lecture 2: Impact Modelling
Learning objectives
At the end of this lecture, you are expected to be able to
- Describe different methods for setting targets
- Explain some data problems related to impact modelling
Some usages of Impact Models
- An impact model describes the relationship between actions and their impact
- It can be used as
- An instrument for analysing how the operation works
- A decision instrument for the development and definition of the vision, mission, goals and strategies
- A tool for estimating the potential impact of decisions
- A control instrument for implementing and following up goals and strategies
Source: https://www.impact.se/en/about-us/our-philosophy/the-impact-model/
EU actions related to CO2 emissions from vehicles
- Regulation (EU) 2019/631 setting new CO2 emission standards for cars and vans.
- From 1 January 2020, this regulation sets an EU fleet-wide target of 95 g CO2/km for the average emissions of new passenger cars.
- Reduction of 15% from 2025 and of 37.5% from 2030 (as compared to 2019)
- Regulation (EU) 2019/1242 setting CO2 emission standards for heavy-duty vehicles
- CO2 labelling of cars
- The Fuel Quality Directive specify requirements on the greenhouse gas intensity of vehicle fuels
- Reduction of the greenhouse gas intensity of transport fuels by a minimum of 6% by 2020.
Source: https://ec.europa.eu/clima/policies/transport/vehicles_en
National actions and instruments related to CO2 emissions from vehicles
- Taxes
- Fuels
- Type of vehicle
- Differentiation (higher in urban areas, …)
- Pricing of national public transports
Source: https://trafikverket.ineko.se/Files/sv-SE/11711/RelatedFiles/2016_043_styrmedel_atgarder_minska_utslapp_vaxthusgaser_20160208.pdf
Impact of National and European actions
Source: https://www.naturvardsverket.se/klimatmal
Setting targets
- Committments made in negotiations
- Similar to others
- Impact modelling, what is realistic
SMART Paradigm
- Goals should be
- S - Specific
- M – Measurable
- A – Attainable
- R – Relevant
- T – Timebound
- But what is realistic (attainable)?
Potential for additional CO2 reductions (to 2030)
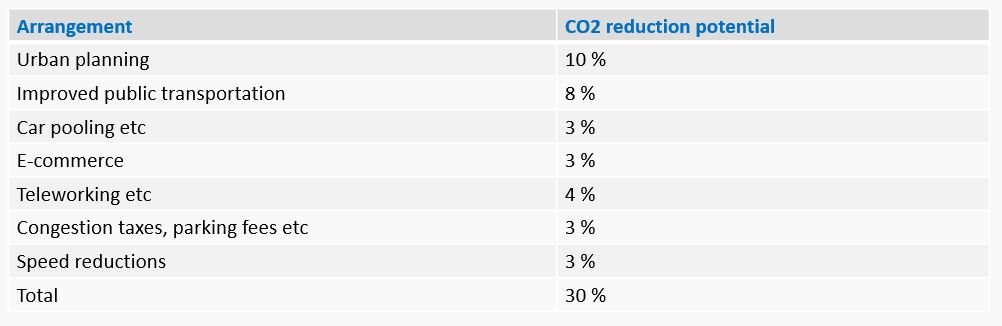
Source: Trafikverket, Report 2017:162
Potential for reducing traffic volume (2018)
| Area | Population | CO2 emission cars (tons) | Car emission per capita |
|---|---|---|---|
| Nyköping | 56 011 | 113 243 | 2.02 |
| Sörmland (county) | 294 695 | 361 673 | 1.23 |
| Sweden | 10 230 000 | 9 940 709 | 0.97 |
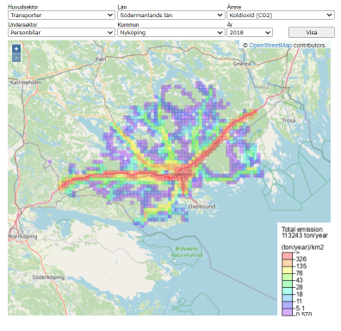
Source: https://utslappisiffror.naturvardsverket.se/Alla-utslapp-till-luft/
Impact of urban planning measures
CO2PassCars = f(TrafficVolume(ToV), TypeOfFuel(ToV), EnergyEfficiency(ToV))
ToV = TypeOfVehicle
- Data source for main factors
- TrafficVolume(ToV) from traffic department
- TypeOfFuel(ToV) from engine producers and independent verifications
- EnergyEfficiency(ToV) from engine producers and independent verifications
- TypeOfVehivles from travel pattern surveys
- The city administration can mainly affect the traffic volume
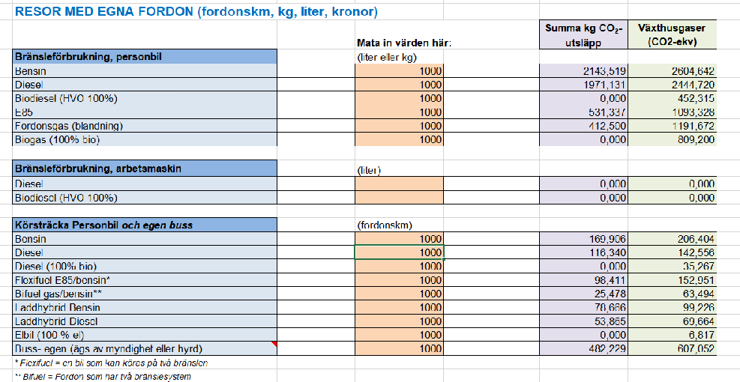
Simple modelling
Traffic modelling in a city
- Most cities use traffic simulation software to forecast the future traffic flows, for instance as a base for decisions about most appropriate traffic solution.
- Usually, the goals of the proposed traffic solution is to increase the capacity of the traffic system and to improve the accessibility. Its impact on CO2 emissions is not always considered.
- The simulation software may work at a macro scale, a meso scale or at a micro scale. The micro simulations often aims to evaluate specific detailed solutions, for instance at road junctions. The macro scale or meso scale simulations may be more appropriate for evaluating the traffic system of an entire city.
Example: Western part of Nyköping
- New developments in the western part of Nyköping
- Some traffic flows needs to be improved
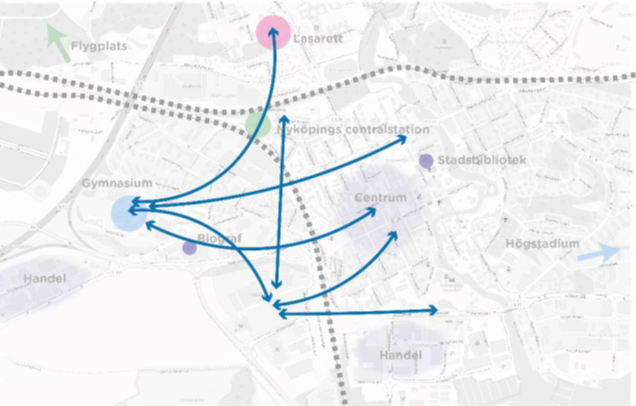
Source: Ramboll, No 1320045998
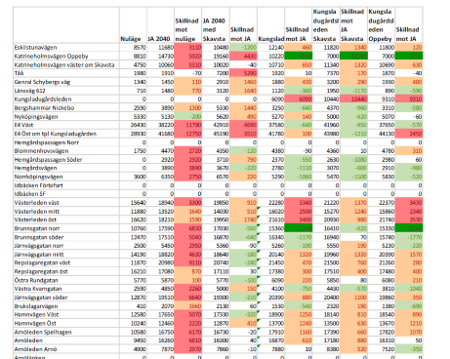
Using the results of the traffic simulations
- The output of a traffic analysis at local level is often an excel table showing the difference in traffic volume at different road segments.
- Our model requires that we know the amount of different types of cars and the length of each road segment.
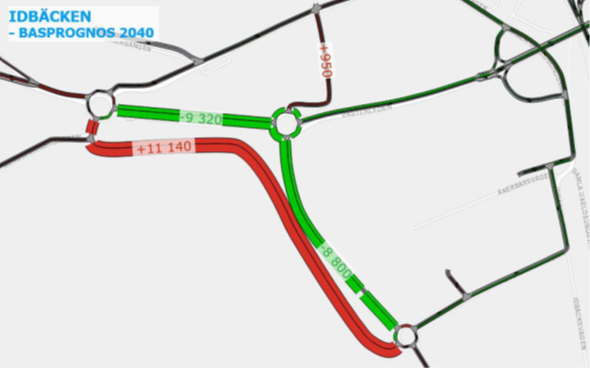
Using the results of the traffic simulations
- The difference in traffic volume may also be visualised on a map.
- This specific map shows only a small part of the proposed new road network
- By using the length of each road segment, we see that the total volume of traffic will increase by around 17 % by year 2040.
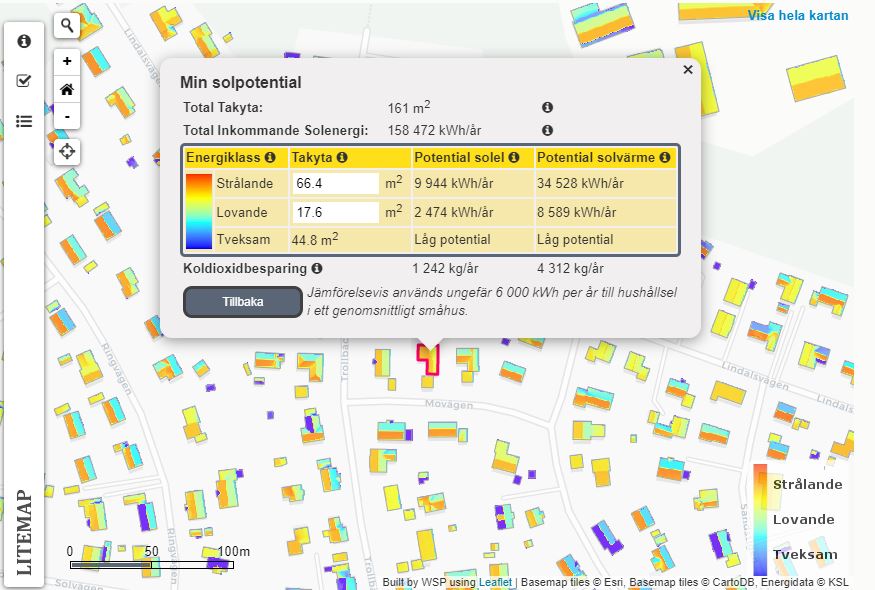
Second example: Potential of roof mounted solar panels
- The electricity production depands on the efficiency of the solar panel, the size, orientation and slope of the panel and the exposure of solar energy
- A rough estimate for Sweden is a potential of 60 kWh per year and m2
- If we know the total size of the roofs in a municipality, we can estimate its potential for roof-based solar production
- Some cities have carried detailed laser scanning surveys and made more accurate estimations at individual house level
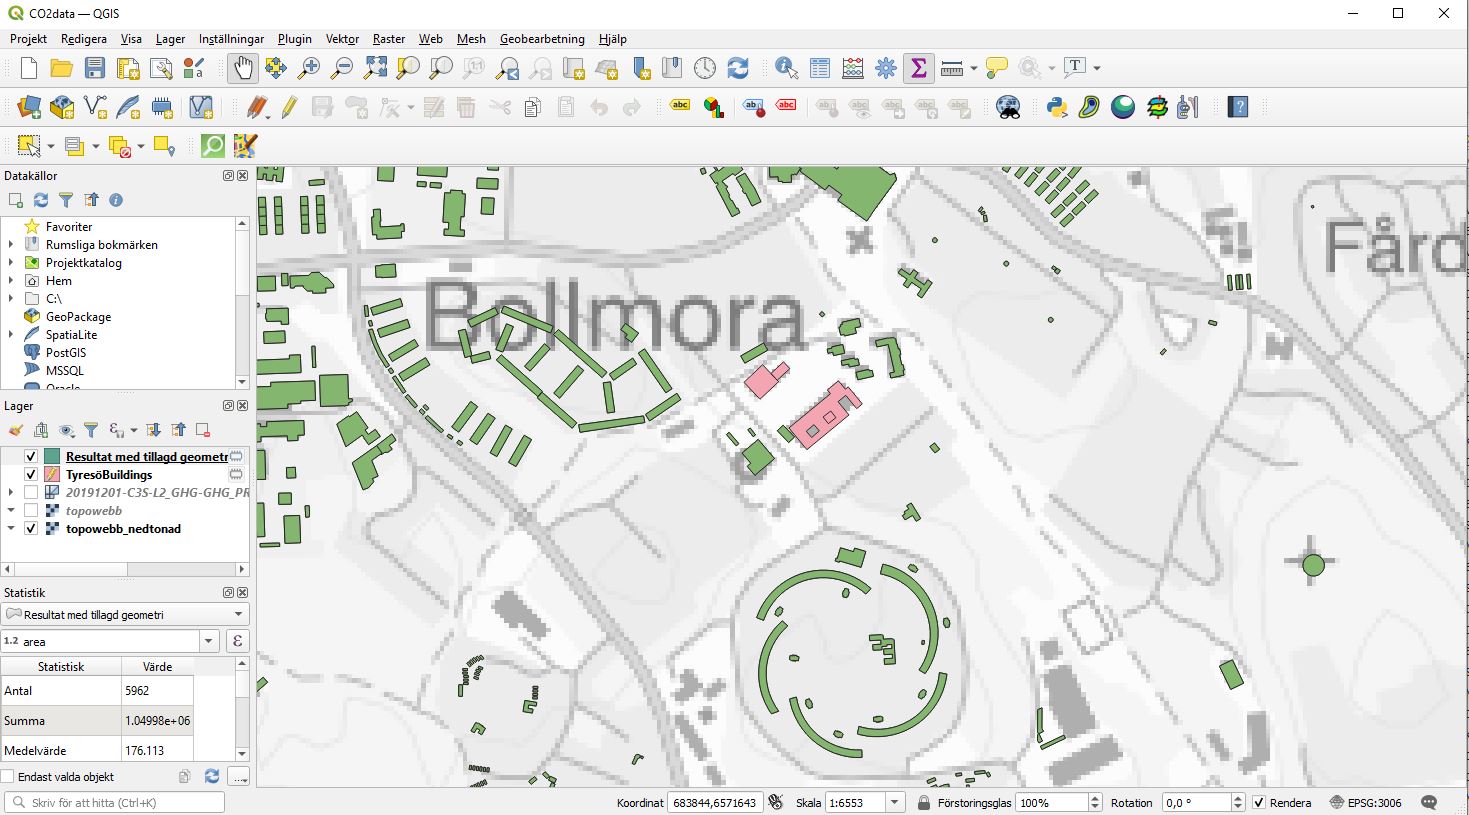
Not all data sources are useful
- This example shows OSM data (Open Street Map) for Tyresö, Sweden
- OSM ias based on crowdsorced data and focussing on streets
- In this case, the buidling layer is very incomplete
- The area of all builidng can easily be calculated using standard GIS tools
- A total roof area of 1,050,000 m2 would correspond to a potential electricity production of around 63 MWh / year
Data Quality Elements
- Geometric accuracy
- Semantic accuracy (thematic, attribute)
- Completeness (feature, attribute)
- Accessibility
Overview of some data sources
| OSM | Urban Map | Primary Map | |
|---|---|---|---|
| Geometric Accuracy | Good | Fair | Good |
| Semantic Accuracy | Good | Poor | Good |
| Completeness | Poor | Good | Good |
| Accessibility | Good | Good | Poor |
Conclusions impact modelling
- There are sveeral impact models in use today, in various fields
- Data availability and data quality are crucial issues
- Open data makes it easier for third parties to develop solutions (impact modelling, data resources, ...)
- Conflicting goals are common