Monitoring CO2 emissions
Monitoring CO2 emissions
Please switch on your audio equipment and play the audios on each slideYou have to start each audio clip manually
Lecture 3: Monitoring CO2 emissions
Learning objectives
At the end of this lecture, you are expected to be able to
- Describe data sources for monitoring of CO2 emissions and content
- Describe data sources of related sectors (air quality, traffic, ...)
- Explain pro's and con's of Copernicus Climate Change Services
- Explain basic principles of forecasting
Why monitoring CO2 emissions?
- Target group(s) / message
- Politicians / Effect of policy decisions
- Politicians / Evaluate efficiency and effectiveness of investments
- Researchers / Indicate impact of actions (verify impact models or C/B models)
- General public / Contribute to a factual and broad public debate
- Schools / Teaching
- Monitoring should, if possible, be based on open statistical records
- Quality criteria: Frequency, accuracy, relevance
Global monitoring of CO2 emissions?
IPCC guidelines for national greenhouse gas inventories
Update of UNFCCC statistics
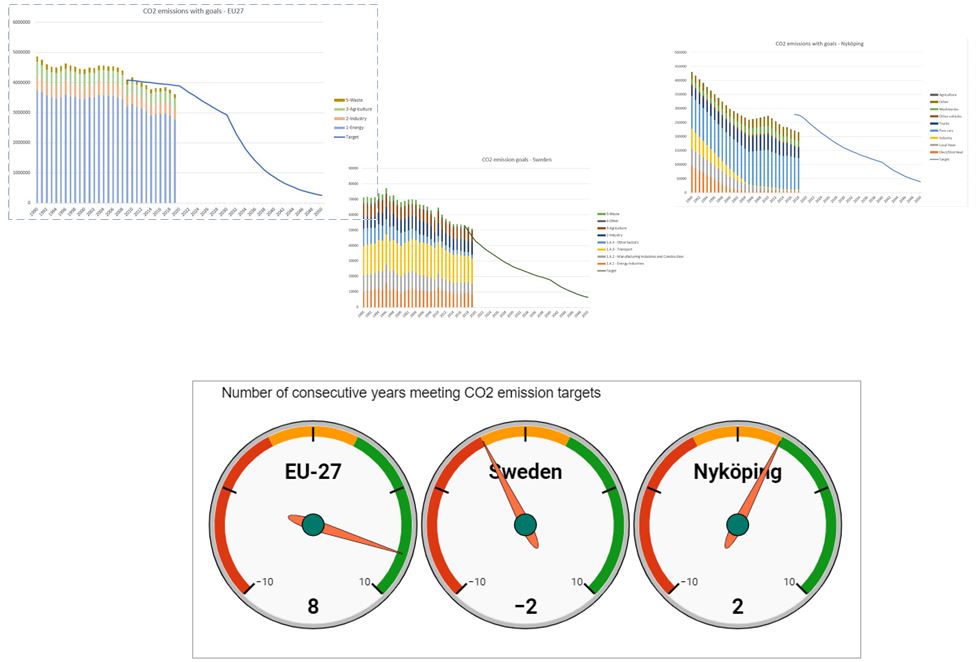
CO2 emissions 2019
- The European statistics for 2019 published in late May 2021
- The target for 2019 was a 0.5 % reduction down to 3905 Tg CO2
- The reported reduction is 4.0 %, down to 3610 Tg CO2
- The national statistics for Sweden is reported in December each year
- The target for 2019 was a 7.8 % reduction down to 47.2 Tg CO2
- The reported reduction is 2.4 %, down to 50.9 Tg CO2
- Possible actions identified for each emission type, for instance
- Transport: Other fuels, public transports, unstudded winter tyres, newer vehicles, …
- Agriculture: Manure, usage of fertilizers, forage additives
- Local data for 2019 to be published in July 2021
How to find data?
- We have several different portals, aimed for searching and downloading
- Geoportals (national, regional, local, sectoral)
- Open data portals (also national, regional, local, sectoral)
- Search engines (Google, Bing, …)
- European portals (EEA, INSPIRE, …)
- What to look for?
- CO2 content in atmosphere?
- Sectoral data?
- Traffic related data (volume, sales of petrol, air pollutants, …)?
- Sectoral policies often include additional objectives, not only CO2 budgets
Air quality data
- Directive 2008/50/EC on ambient air quality and cleaner air for Europe
- Specify monitoring and reporting obligations related to air quality
- What to monitor (SO2, NOx, CO, PM, …), selection of sampling points, thresholds etc.
- CO2 not included in this directive
- Directive 2004/107/EC relating to arsenic, cadmium, mercury, nickel and polycyclic aromatic hydrocarbons in ambient air
- Directive (EU) 2016/2284 on the reduction of national emissions of certain atmospheric pollutants
EEA air pollution map
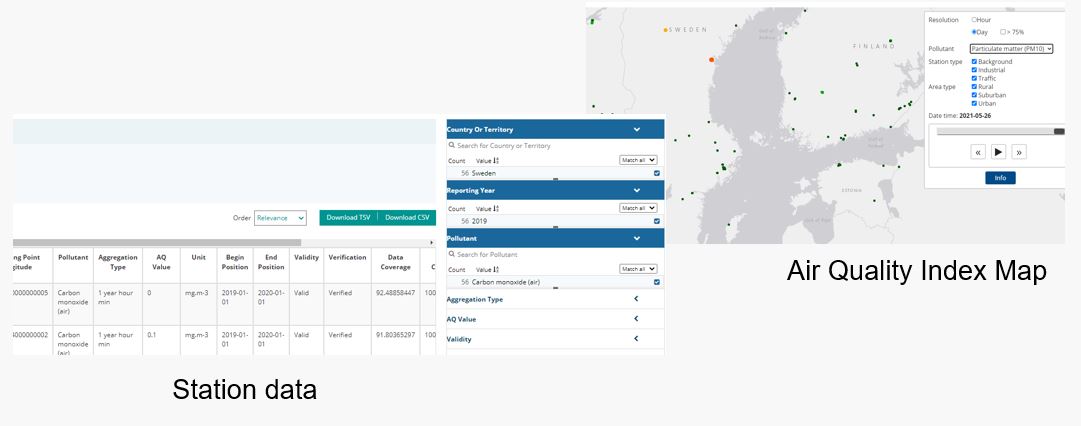
Source https://www.eea.europa.eu/themes/air/explore-air-pollution-data
INSPIRE Data
- Directive 2007/2/EC establishing an infrastructure for spatial information in the European community (INSPIRE)
- Aiming to provide interoperable spatial data of Europe
- Structured into 34 data themes
- Air quality data can be found in the following themes
- Atmospheric conditions
- Environmental monitoring facilities
- Meteorological geographical features
Geoportal: https://inspire-geoportal.ec.europa.eu/
INSPIRE data grouped after reporting obligation
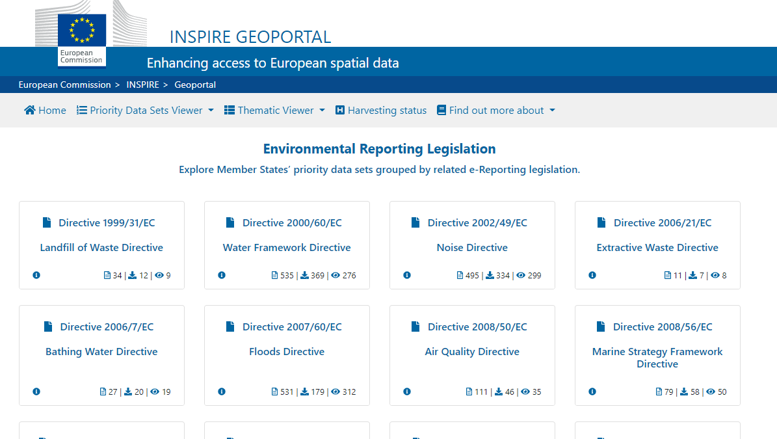
For Sweden, air quality data according to OGC-SOS is provided
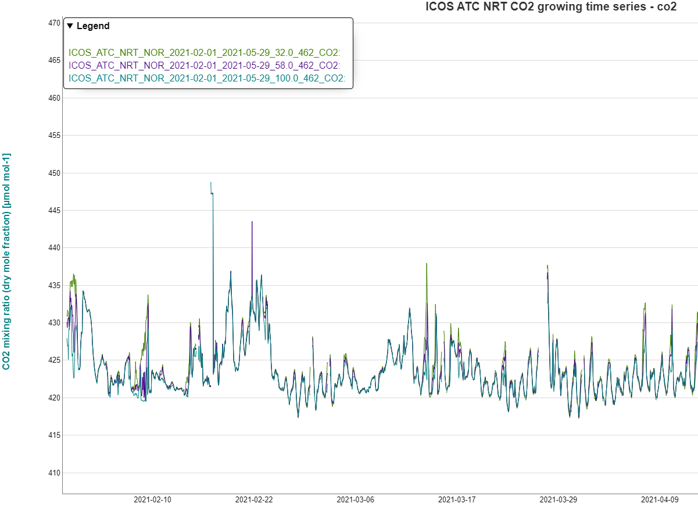
ICOS Carbon Portal
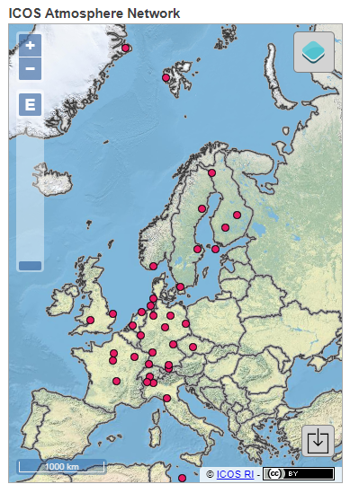
Source https://www.icos-cp.eu/
ICOS measurements Norunda
Copernicus Climate Change Service
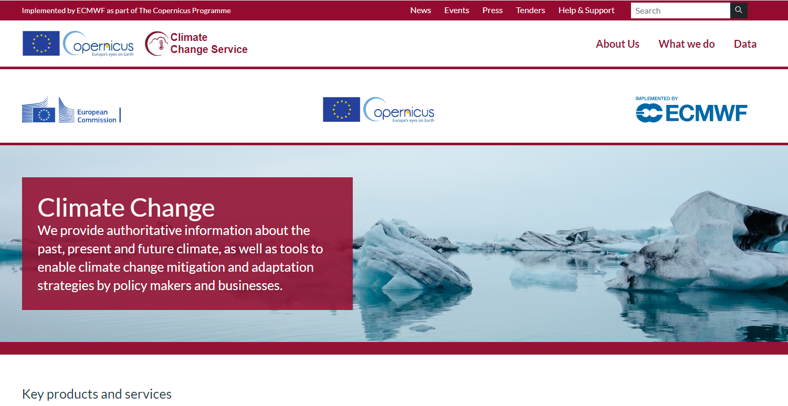
https://climate.copernicus.eu/
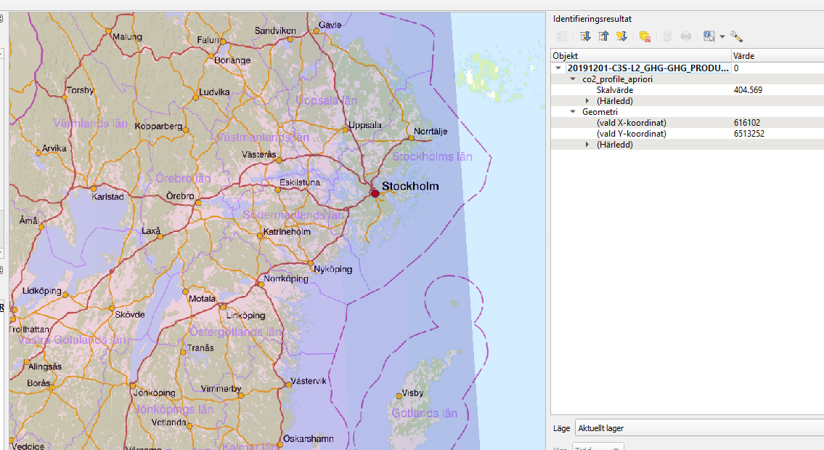
Downloading C3S data
- Geometric Resolution: TANSO - around 10 km x 10 km
- Temporal coverage: 2003 – 2019
- Temporal resolution: According to satellite orbits
- File format: NetCDF4 (Can be read by QGIS as mesh)
- Reference system: Lat-Long Grid
CO2 at Nyköping, 2019-12-01
From SDI to business ecosystems
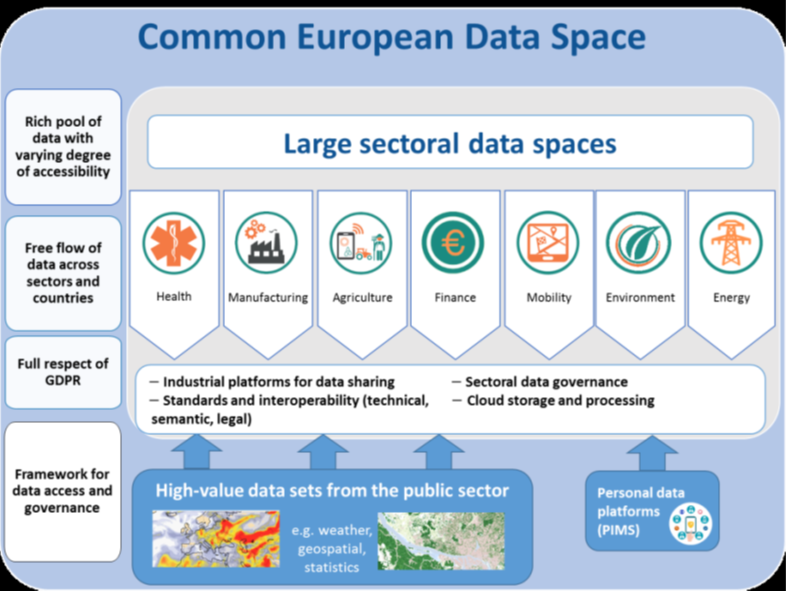
Source: DG CNECT
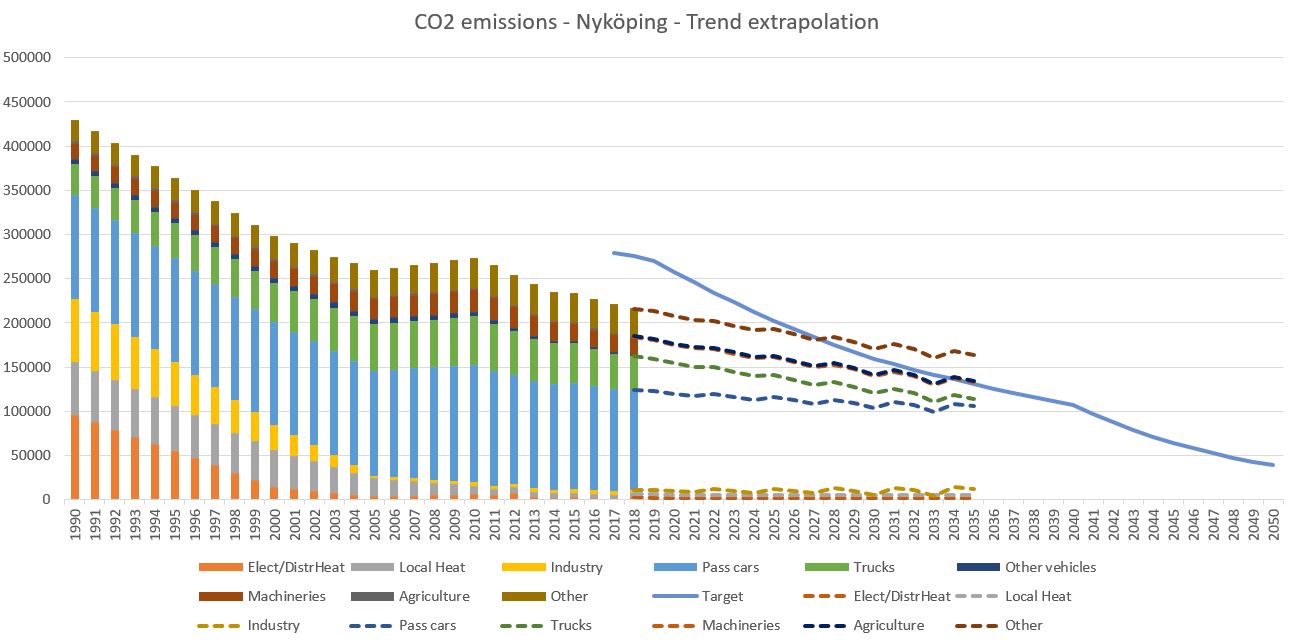
Forecasting and trends
- Autoregressive models is a simple way of forecasting, or to be more precise, extrapolation of trends
- The autoregressive model specifies that the output variable depends linearly on its own previous values and on a stochastic term
- In this case, we will use a third order AR model for predicting future values
- We will use different AR models for each sector (agriculture, industry, private cars etc)
- Each AR model can be replaced by a better forecast, if we have such forecasts available
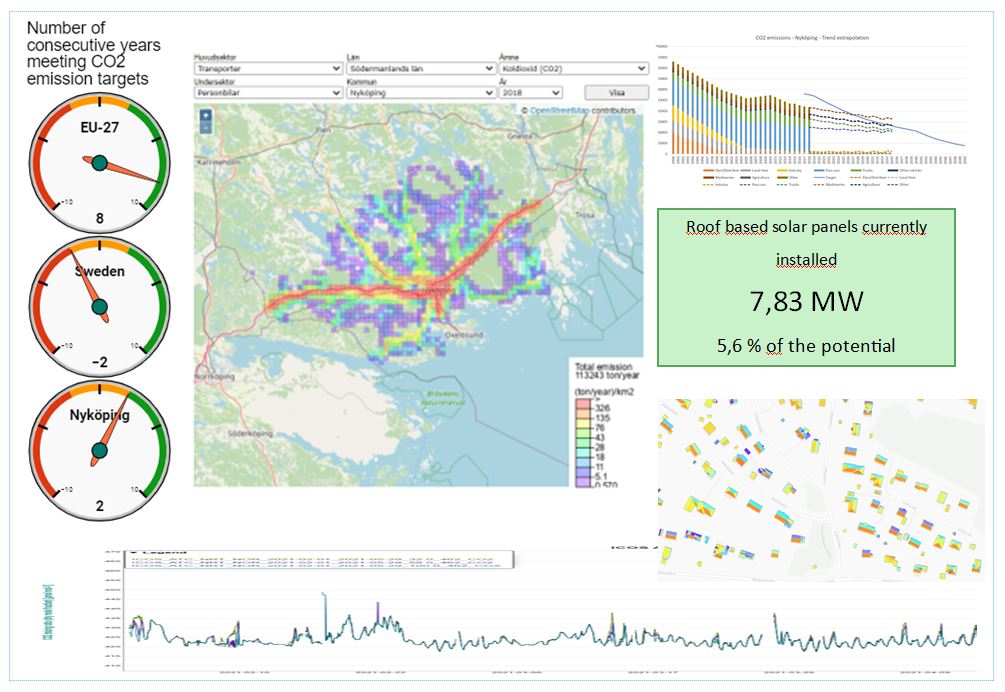
Environmental dashboards