CO2 budgets for municipalities - An introduction
Lecture 1: Current status of CO2 emissions
Learning objectives
At the end of this lecture, you are expected to be able to
- Explain what a CO2 budget is
- Describe the basic content of a CO2 budget
- Describe how CO2 budgets may be used
First some basic concepts
- A CO2 budget (carbon budget) is the upper limit of CO2 emissions in order to remain below a specific average global temperature
- The global CO2 budget can be split in space and time
- Please note that CO2 emissions are to a great extent accumulated in the atmosphere. This means that overspending one year has to be compensated the following years
- CO2 budgets are considered to be an attractive analytical tool for a wide range of climate change analysis
- Greenhouse gas emissions are usually expressed in CO2 equivalents
- 1 kg carbon (C) = 3.664 kg carbon dioxide (CO2)
Anthropogenic perturbation of the global carbon cycle
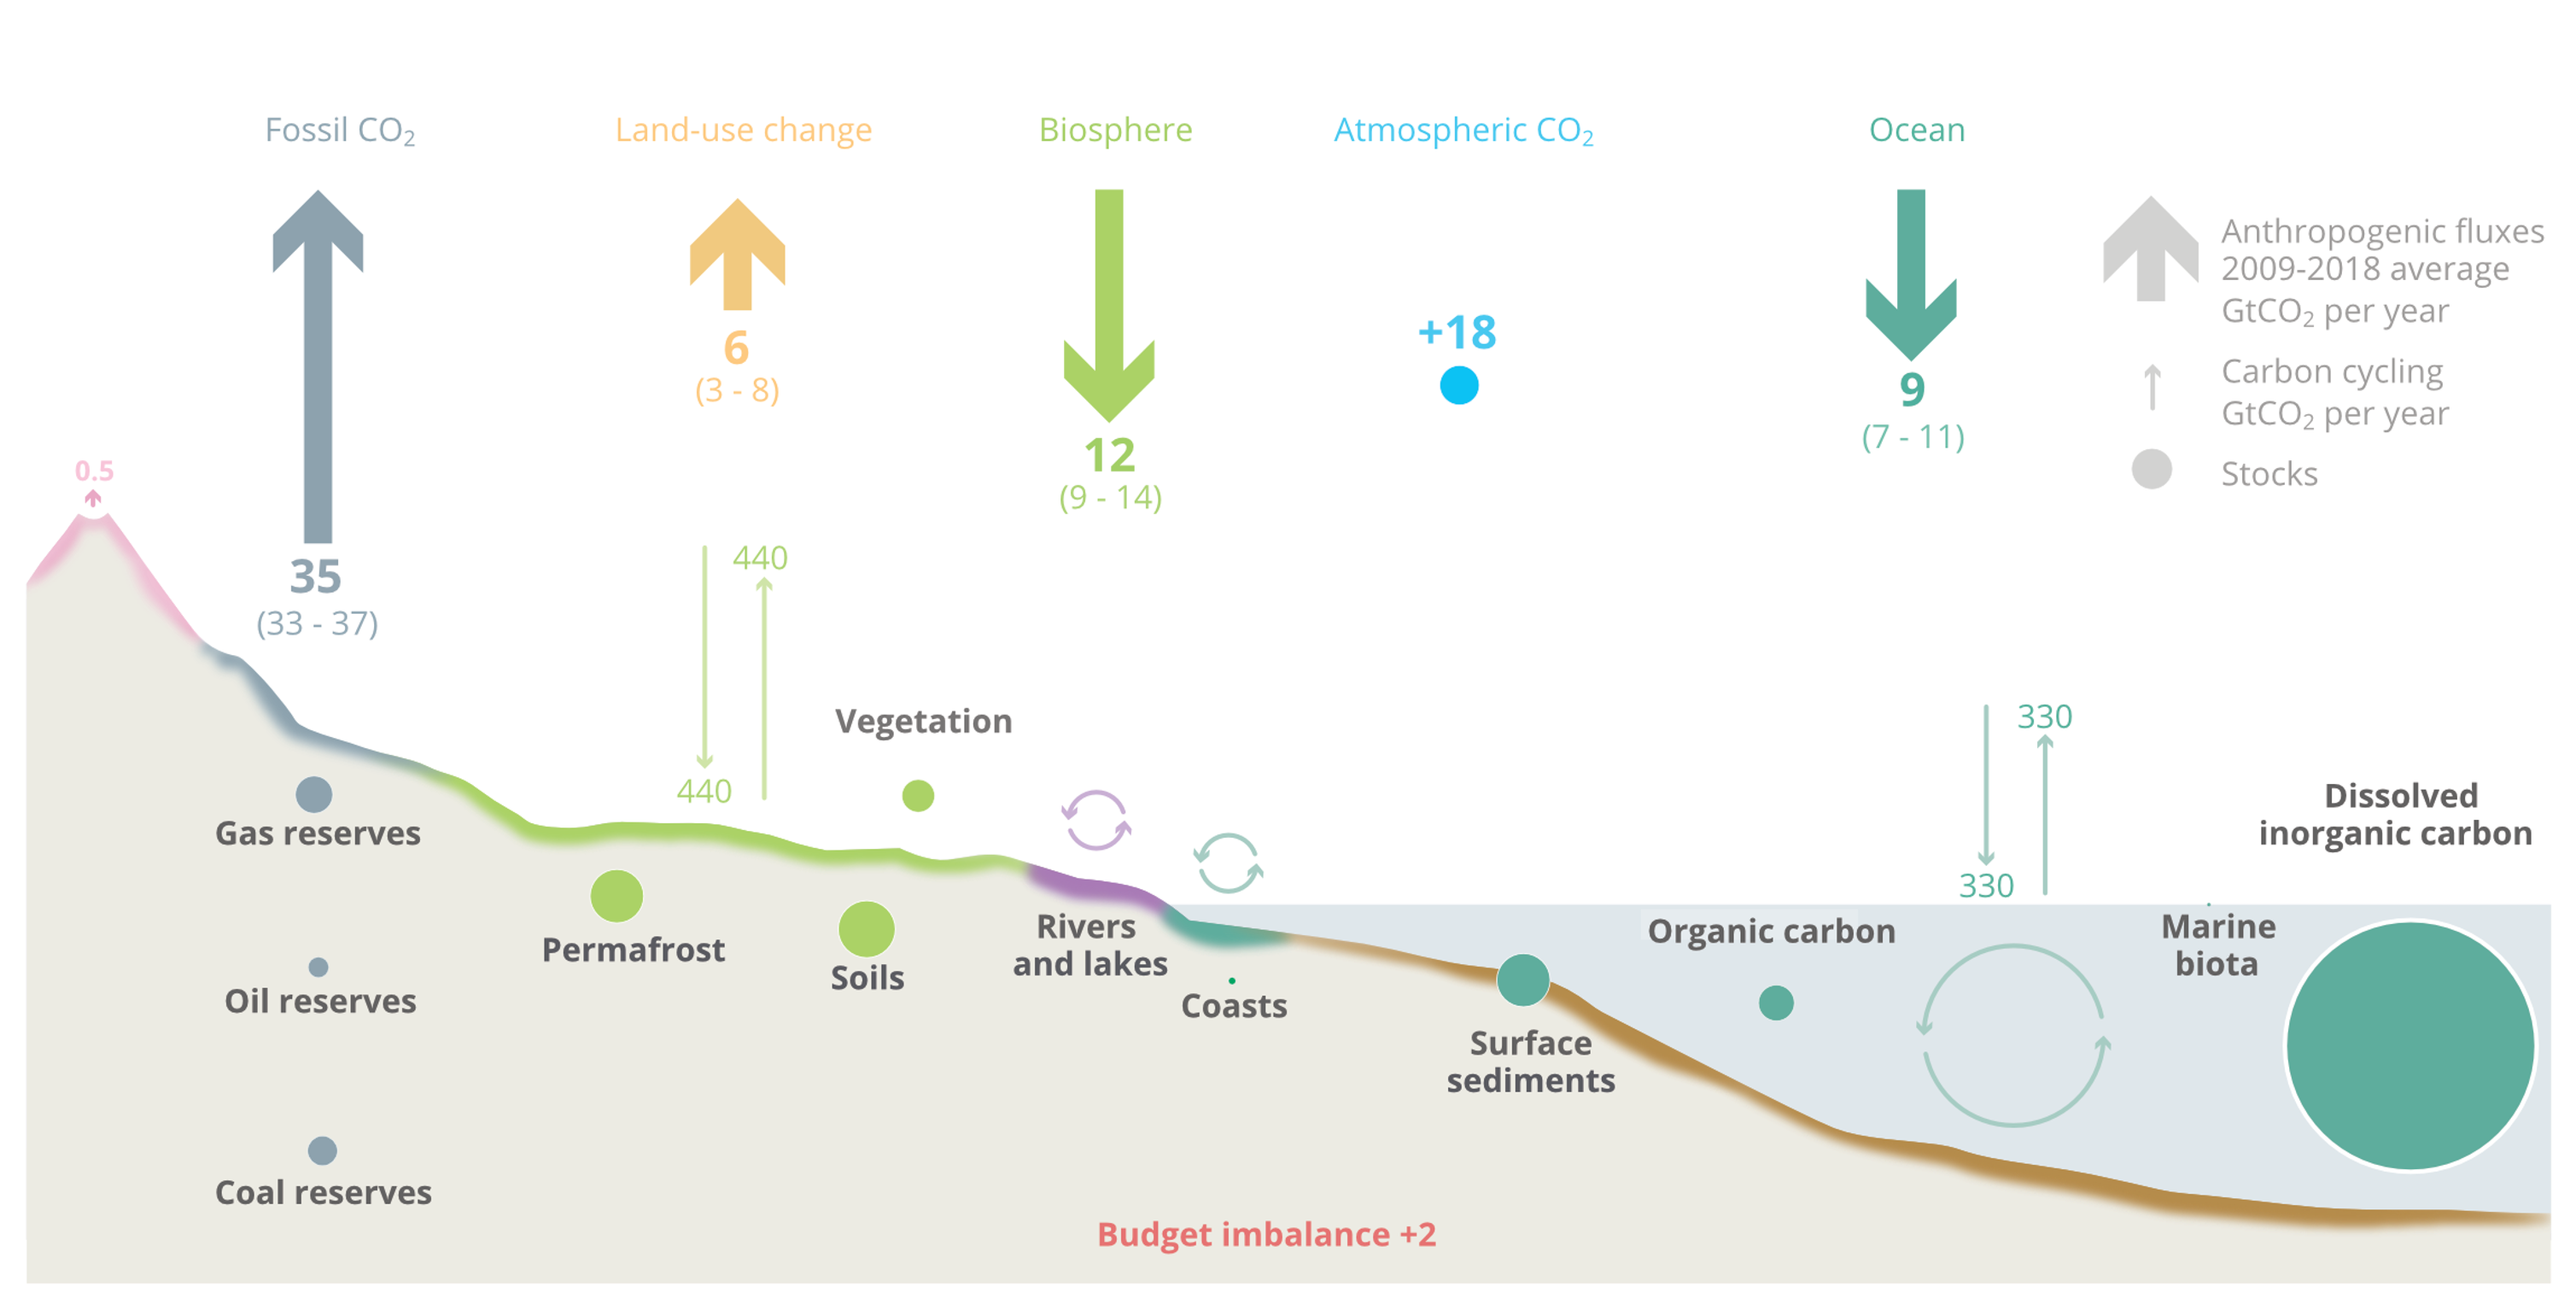
Source: Global Carbon Project (2019).
Scenarios
The bold lines are scenarios that will be analysed in CMIP6 and the results assessed in the IPCC AR6 process.
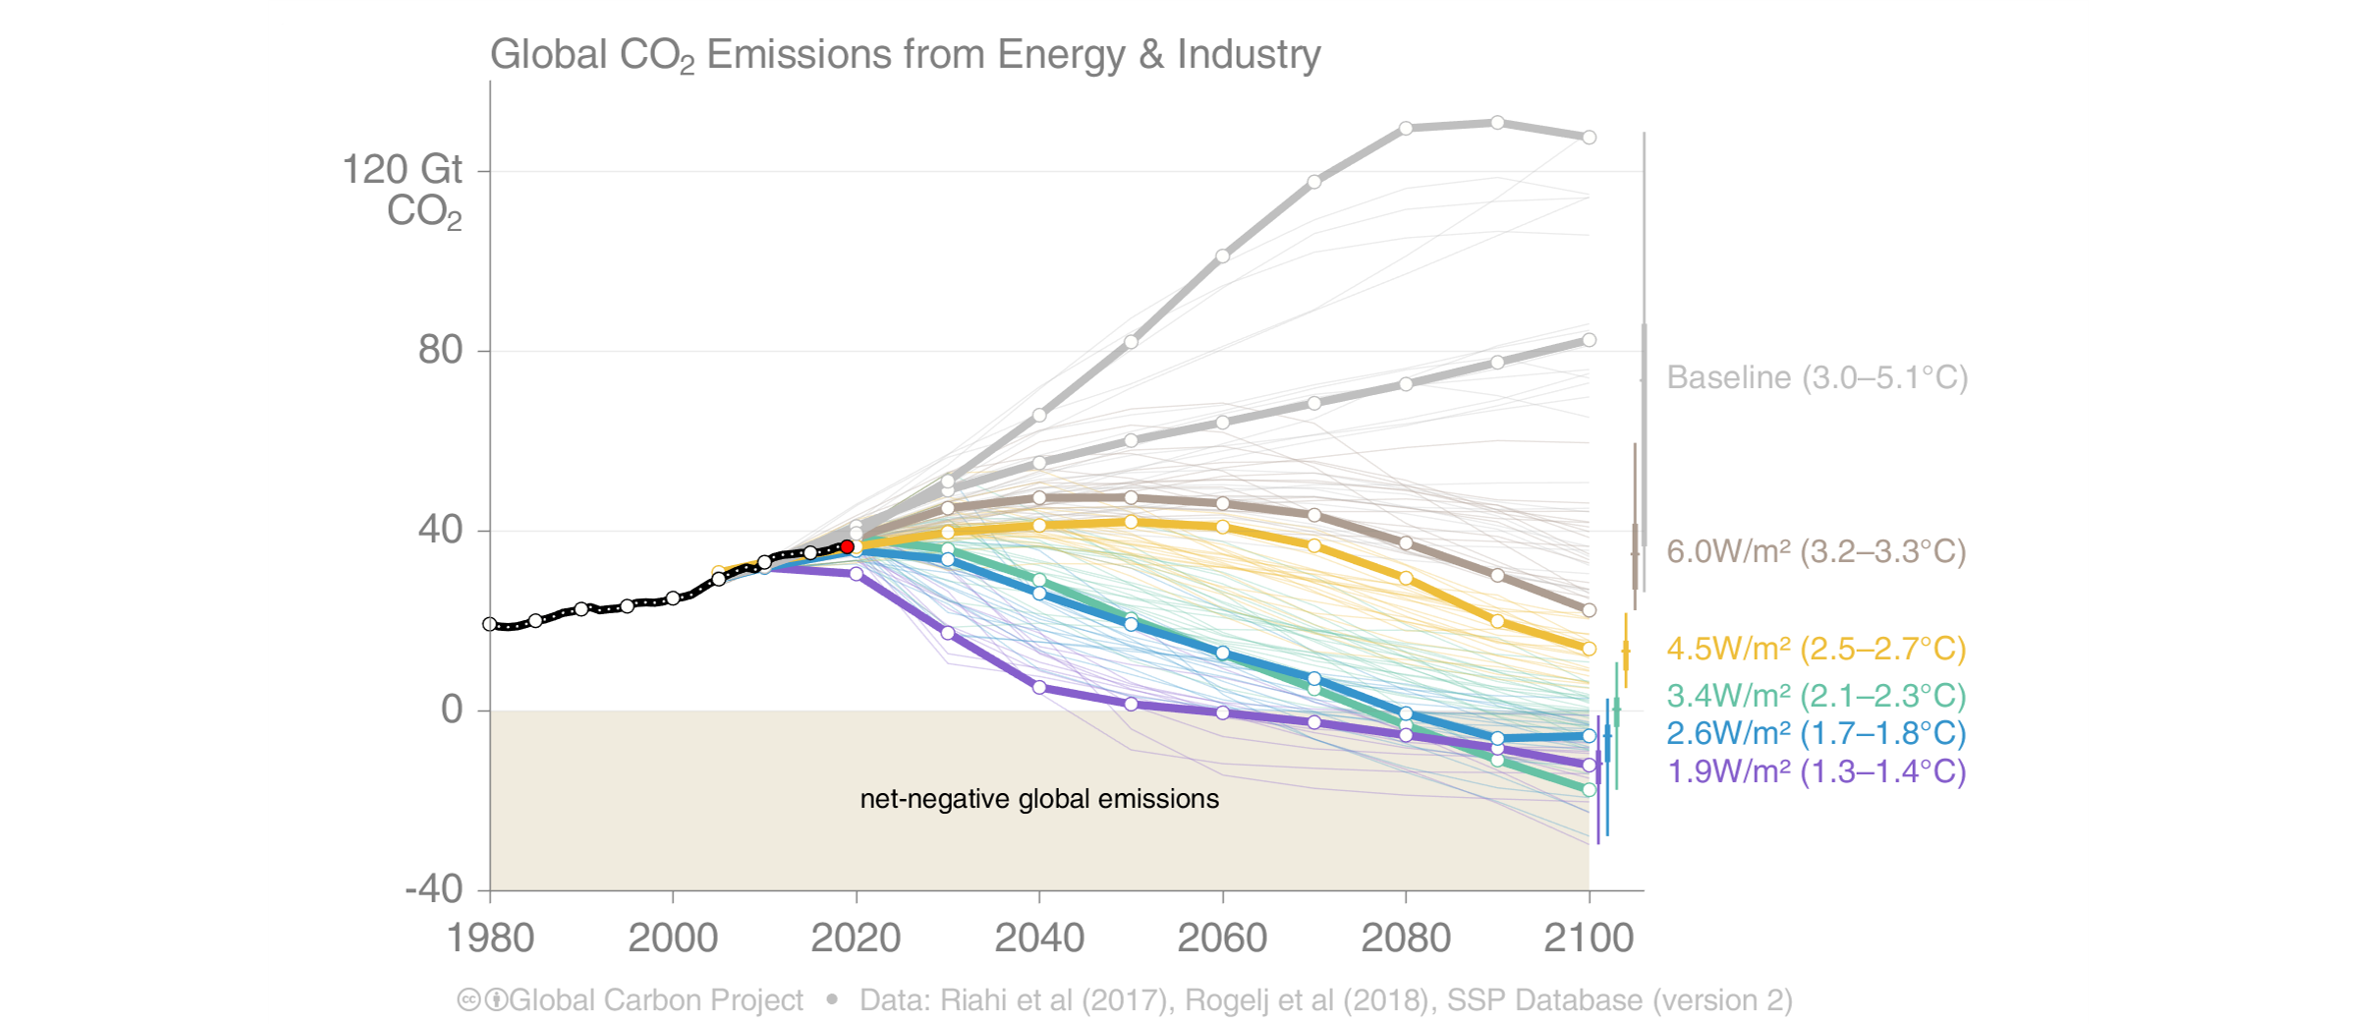
Source: Global Carbon Project (2019)
Top emitters: Fossil CO2 Emissions
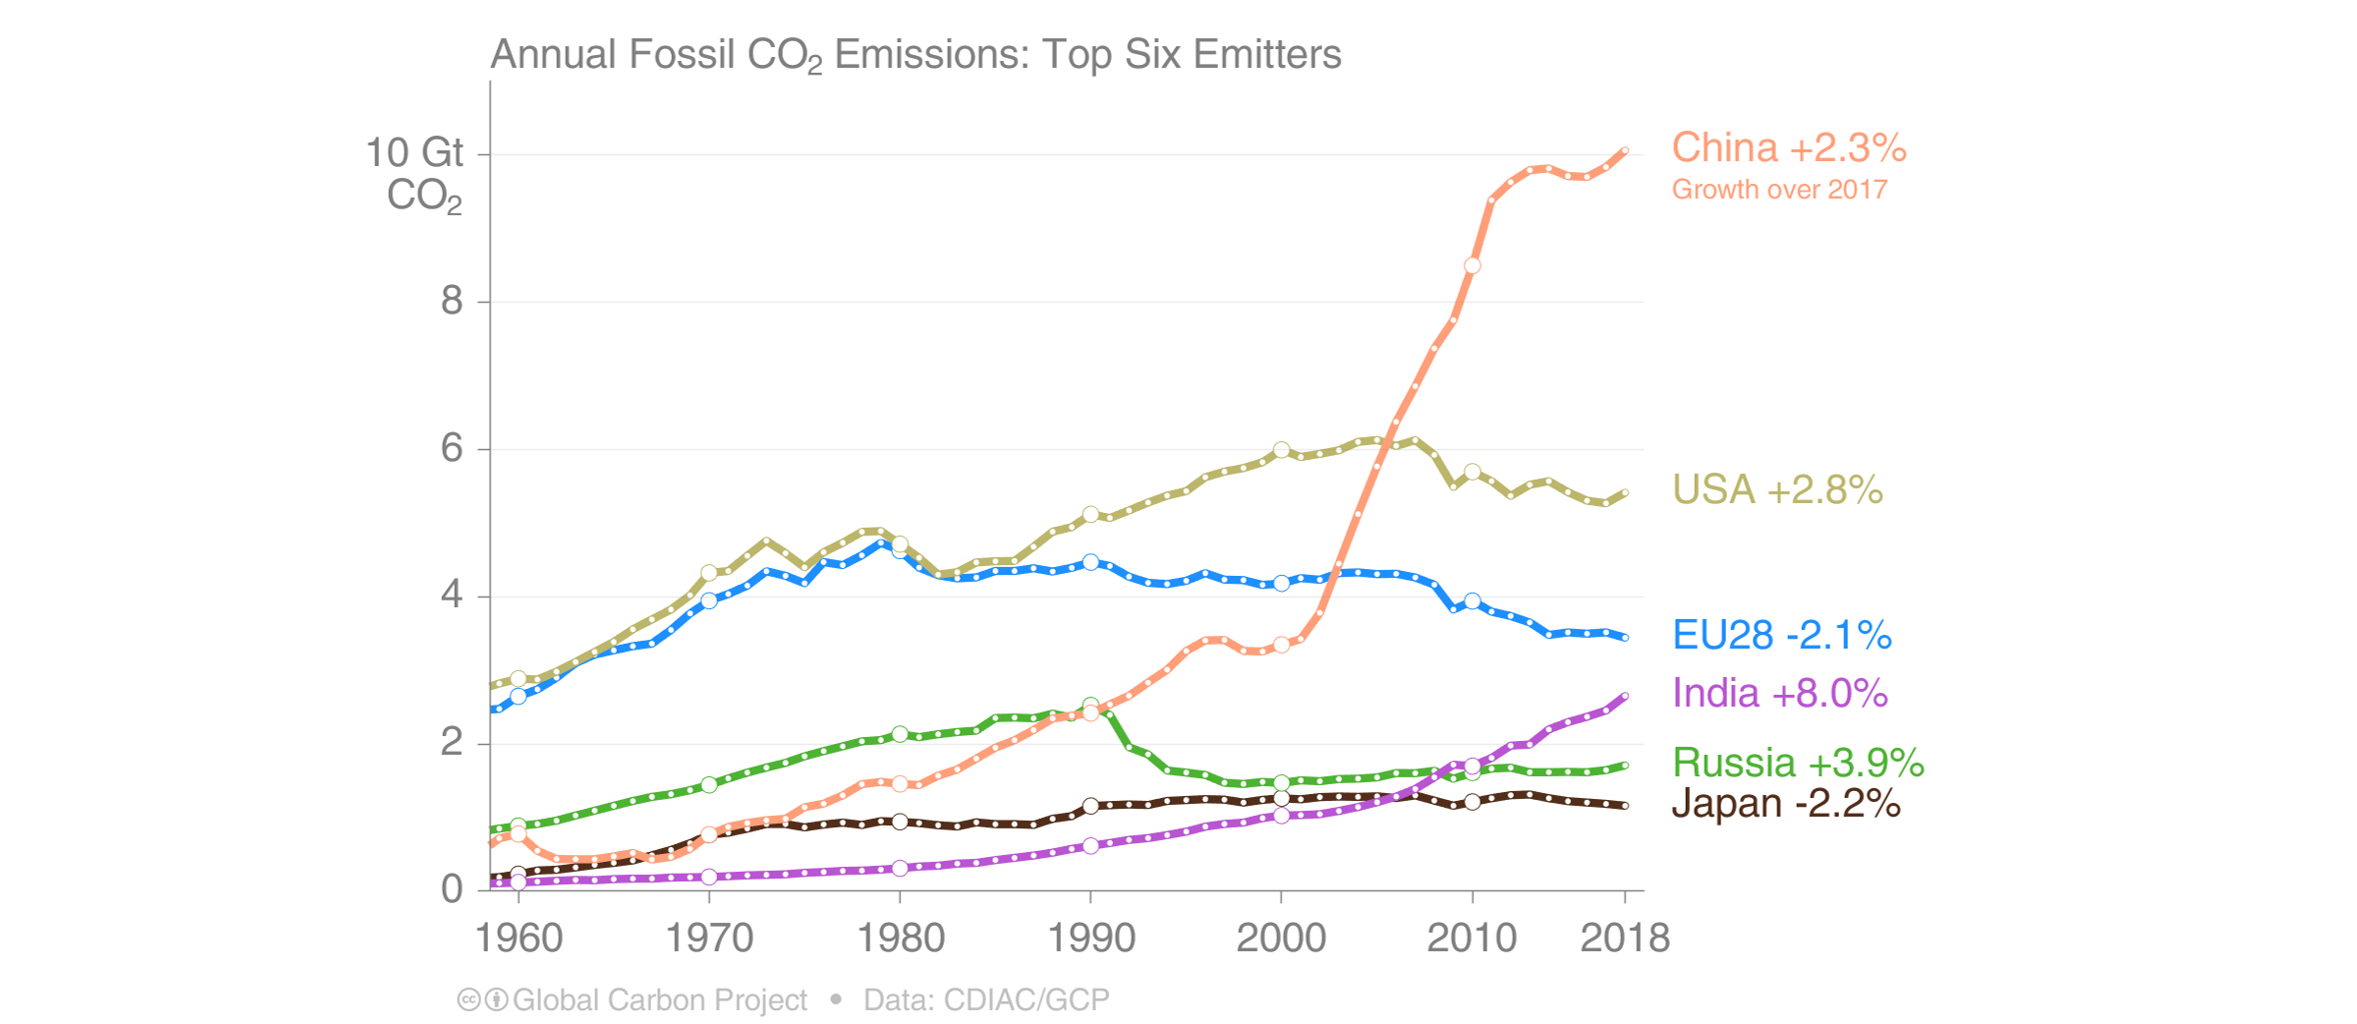
Source: Global Carbon Project (2019)
Content of a CO2 budget
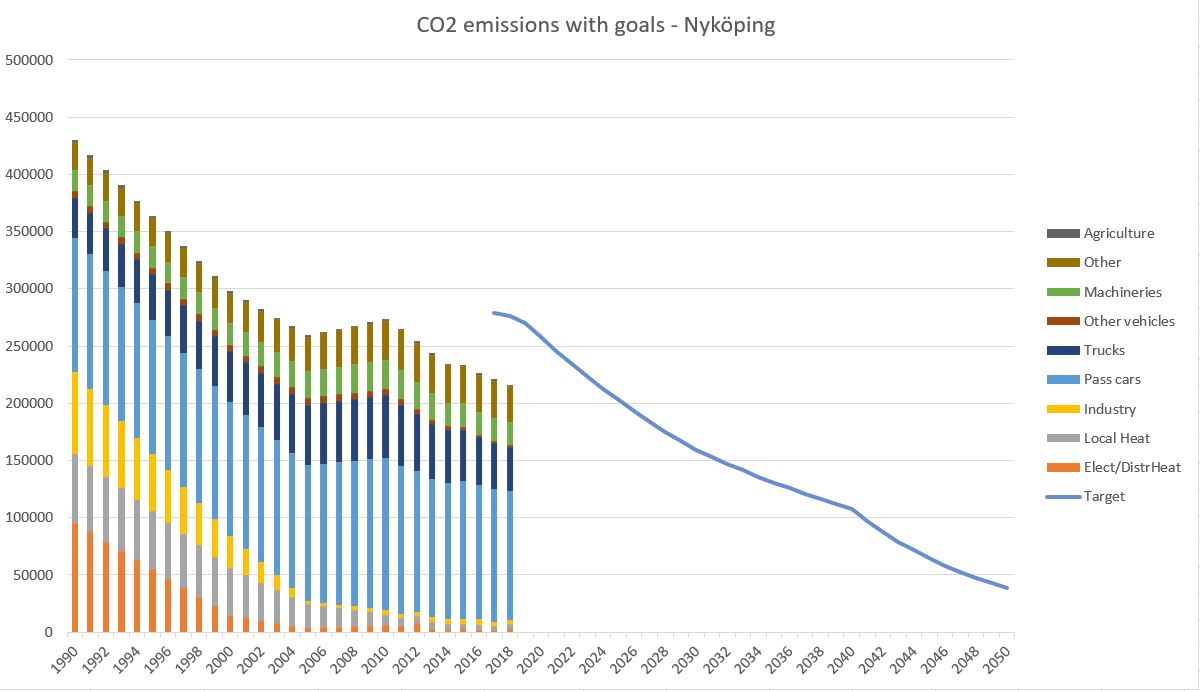
- Curren status
- Emissions, goals and targets
- Pathways to net zero emissions
- Sector pathways, sectoral goals, KPI
- Monitoring
- Around 13 % of the Swedish municipalities have established CO2 budgets. Additional 25 % have started their preparations
Reporting of CO2 emissions
UN framework convention on climate change (UNFCCC)
- The united nations entity supporting the global response to climate change
- Has nearly universal membership (197 parties)
- Is the parent treaty of the 2015 Paris agreement, and the parent treaty of the 1997 Kyoto protocol and its Doha amendment, adopted in 2012.
- EU member states reports yearly emissions to UNFCCC. Sectoral data according to the IPCC classification are also delivered
EEA Greenhouse Gas – Data Viewer
Link to EEA Greenhouse Gas Data Viewer
- You can download data in excel format for
- Year 1990 – 2019
- Single or multiple countries
- IPCC sectors
- Aggregated sectors
- Different GHG (Greenhouse gases)
- Good to know
- LULUCF (Land Use, Land Use Change and Forestry)
- Negative values = Carbon sink
EU targets
- 2020 climate and energy package, from 2007
- By 2020, 20% cut in greenhouse gas emissions (from 1990 levels)
- https://ec.europa.eu/clima/policies/strategies/2020_en
- 2030 climate and energy framework
- By 2030, at least 40% cuts in greenhouse gas emissions (from 1990 levels)
- https://ec.europa.eu/clima/policies/strategies/2030_en
- 2050 long term strategy
- The EU aims to be climate-neutral by 2050 – an economy with net-zero greenhouse gas emissions
- https://ec.europa.eu/clima/policies/strategies/2050_en
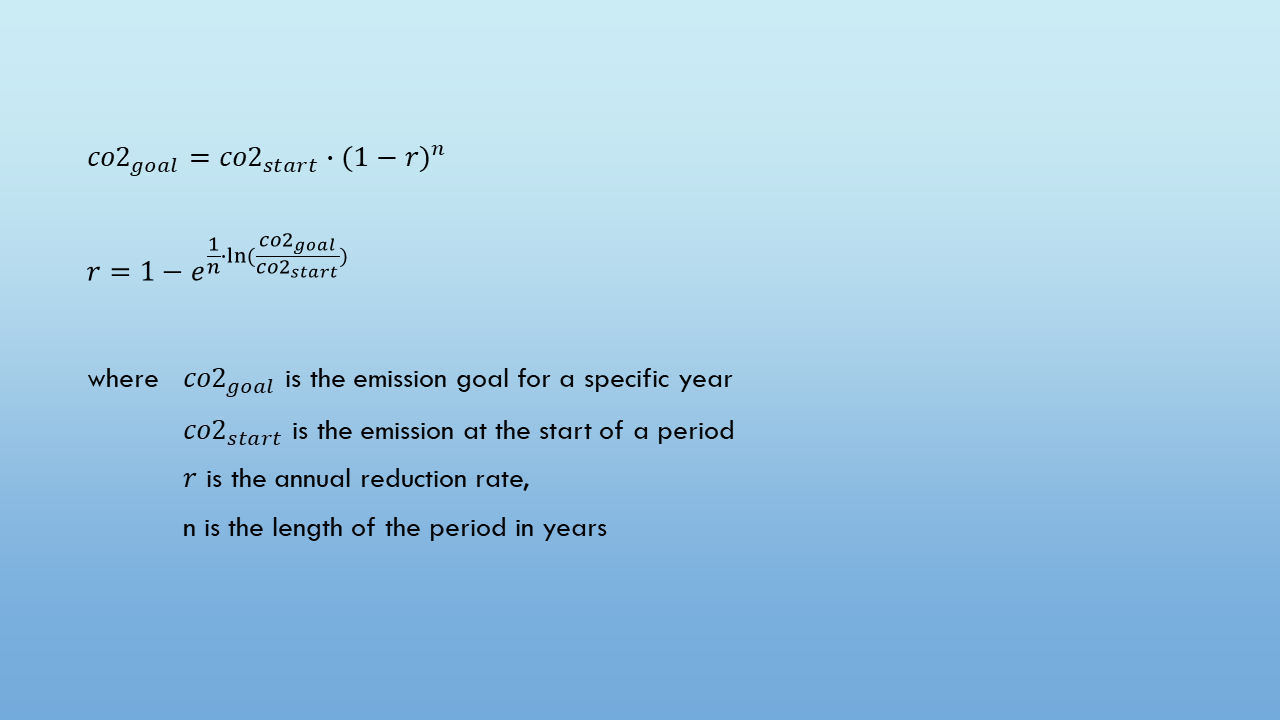
Fixed percentage annual reduction
- We have actual emission values for the period 1990 – 2018 and emission goals for 2020, 2030 and 2050.
- We need a goal model specifying the annual change in emissions in order to reach the overall emission goals. One simple goal model is to assume a fixed annual reduction in percent. This model may be formulated as
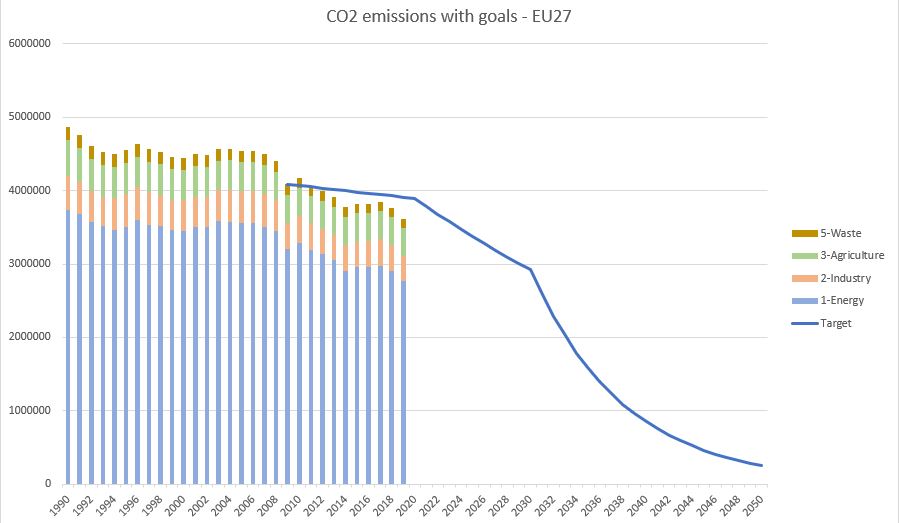
EU27 emission graphs with targets
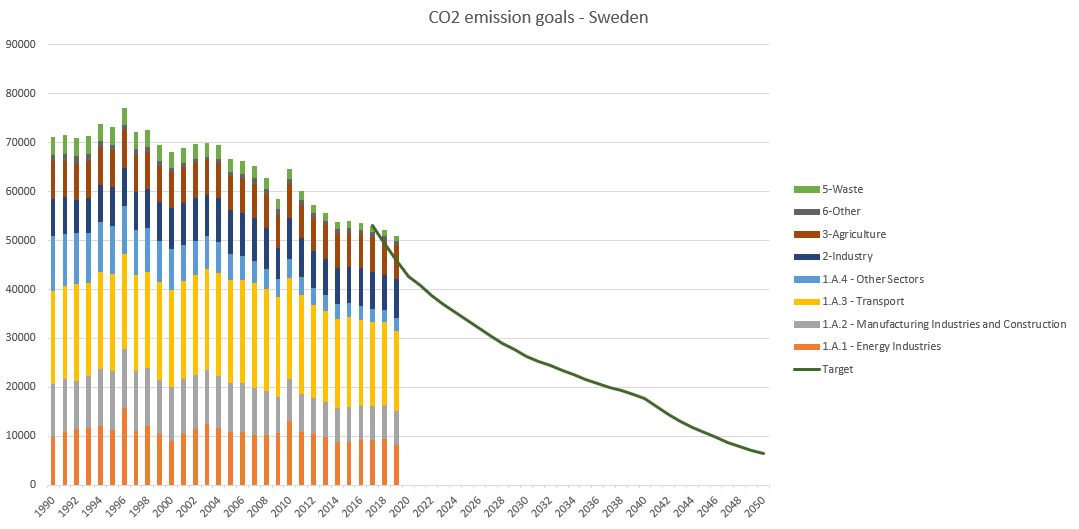
Swedish targets (2017)
- By 2020, 40% cut in greenhouse gas emissions (from 1990 levels)
- By 2030, 63% cut in greenhouse gas emissions (from 1990 levels)
- By 2040, 75% cut in greenhouse gas emissions (from 1990 levels)
- By 2045, 85% cut in greenhouse gas emissions (from 1990 levels)
Local Emission Data
- Swedish Emission Database
- Statistics can be presented as maps (km2 grid), diagrams (national and county levels) and spreadsheets (national, county and municipal levels)
- I have not investigated where to find local emission data for other countries