Object-based Image Analysis (OBIA)
An introductory course
Assoc-Prof Dr Stefan LANG | contributor: Assoc-Prof Dr Dirk Tiede[1] Why spatial image analysis? | [2] Regions and image objects | [3] Image segmentation | [4] Knowledge representation | [5] Class modelling
University of Salzburg, Department of Geoinformatics, 2021/22/23
[1] Why spatial image analysis?
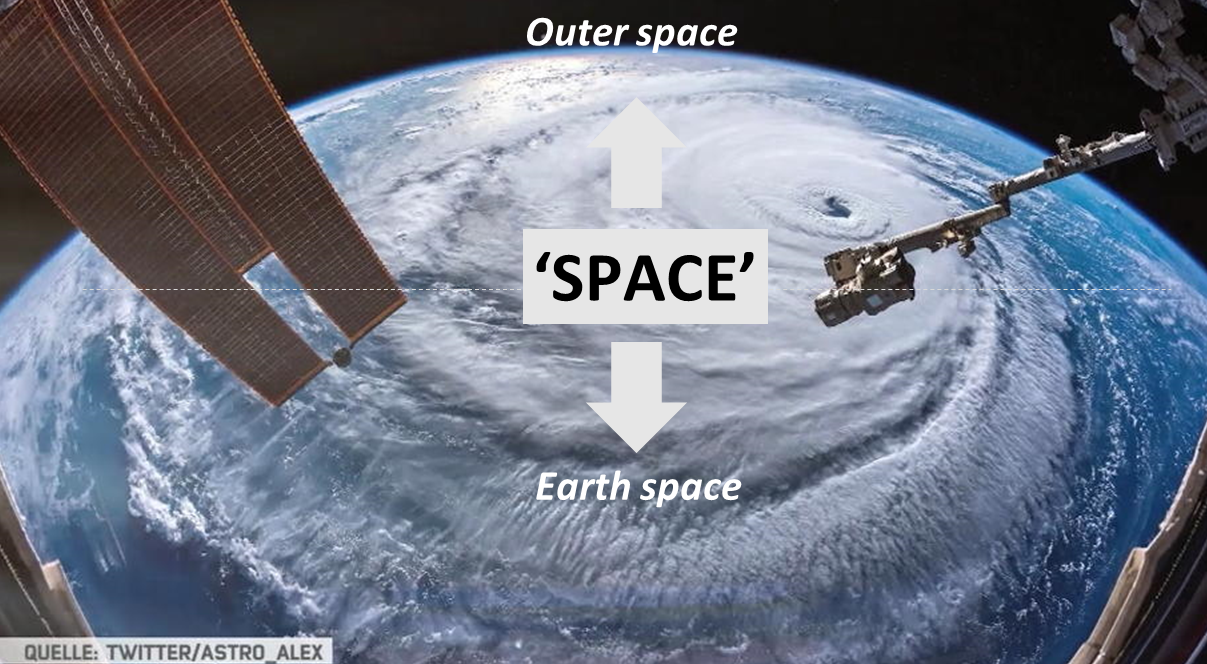
Space and spatial image analysis
 https://www.youtube.com/watch?v=c7OO3qCfH9Y
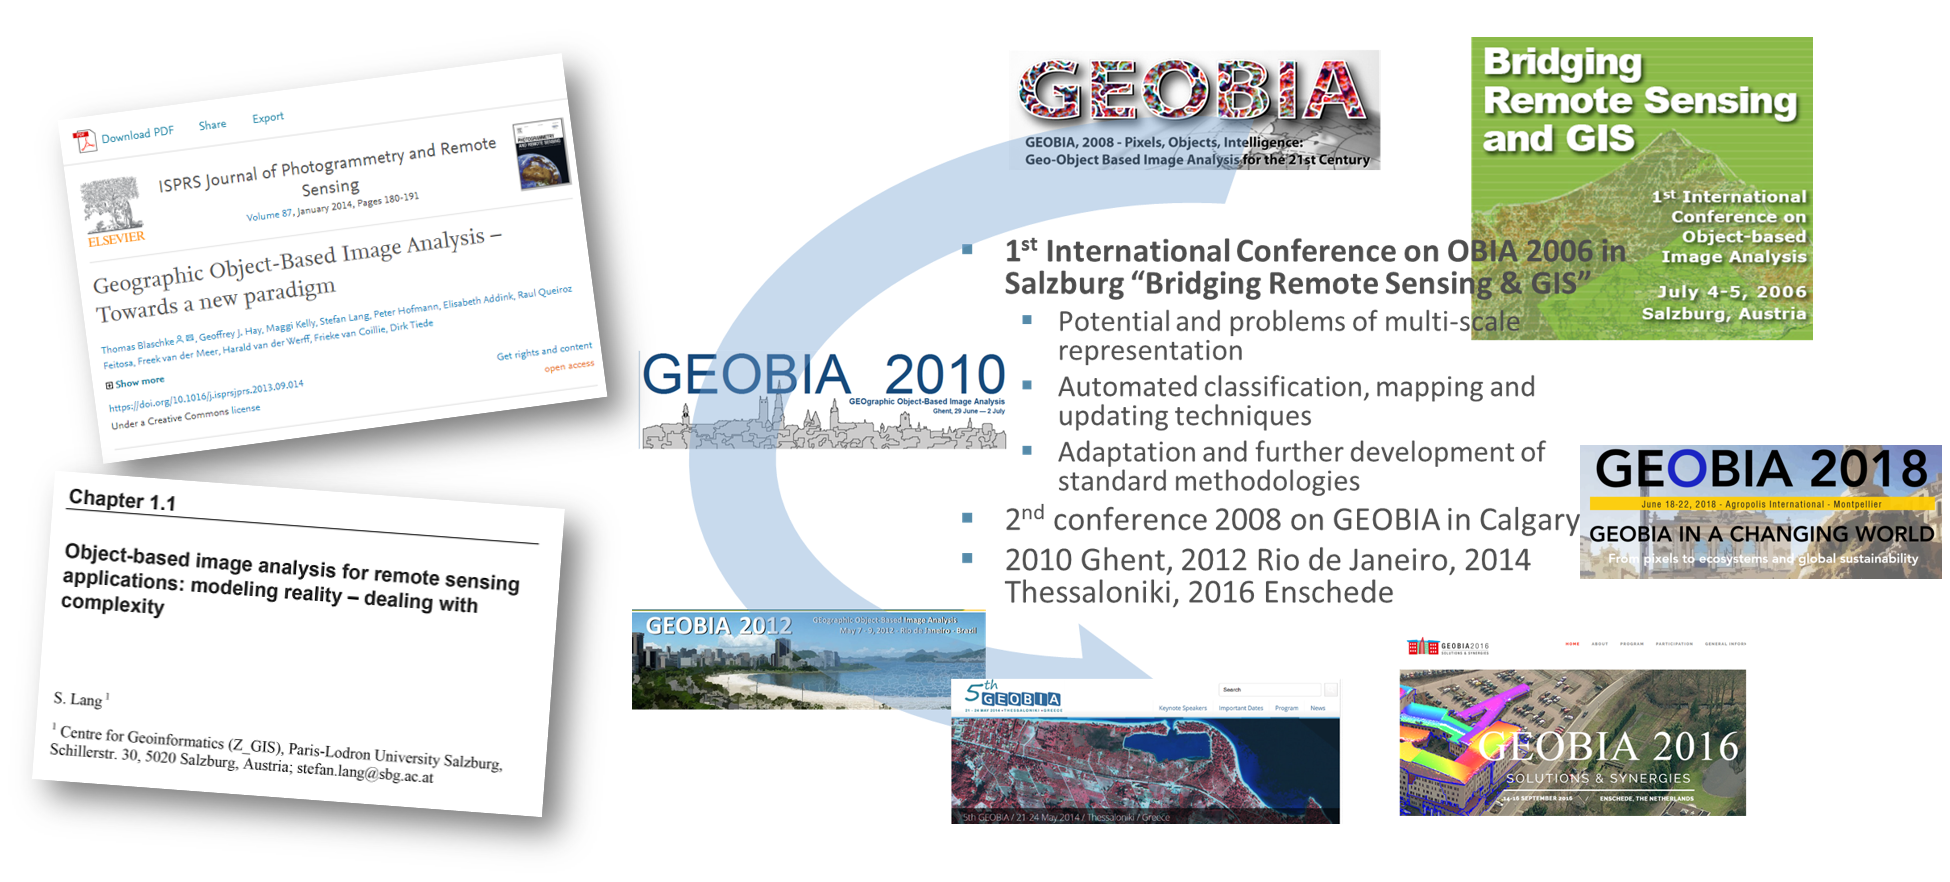
Spatial image analysis - bridging remote sensing and GIS
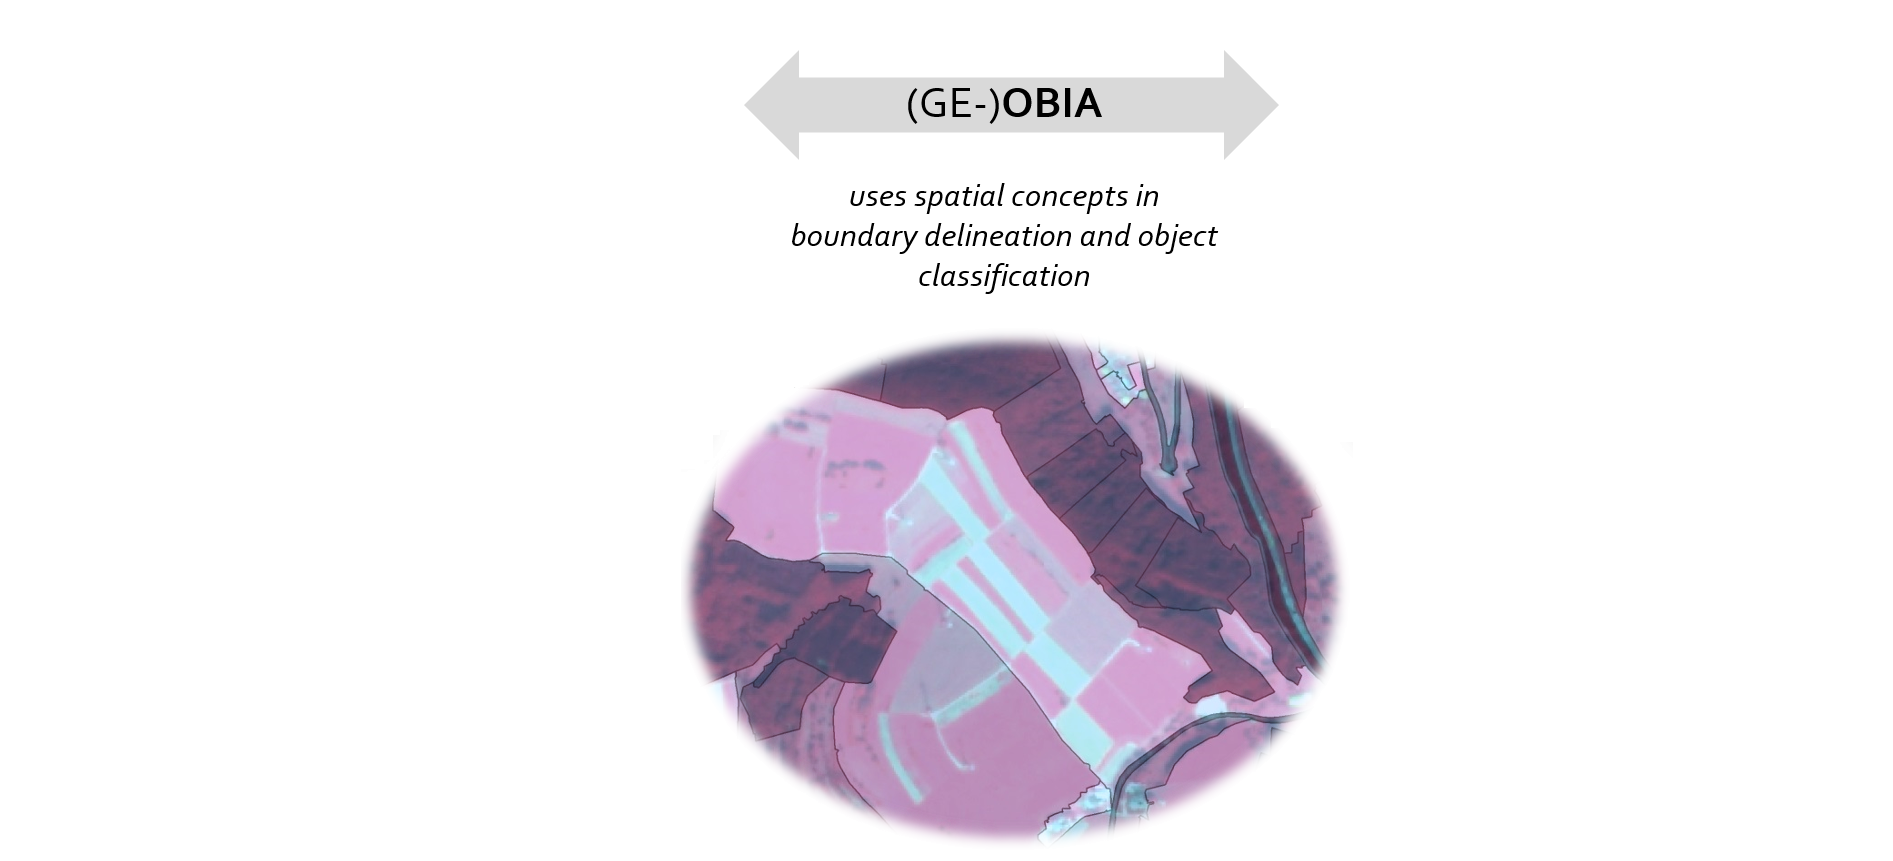
Geographical OBIA (GEOBIA) - a paradigm in image analysis
GEOBIA - trans-application potential

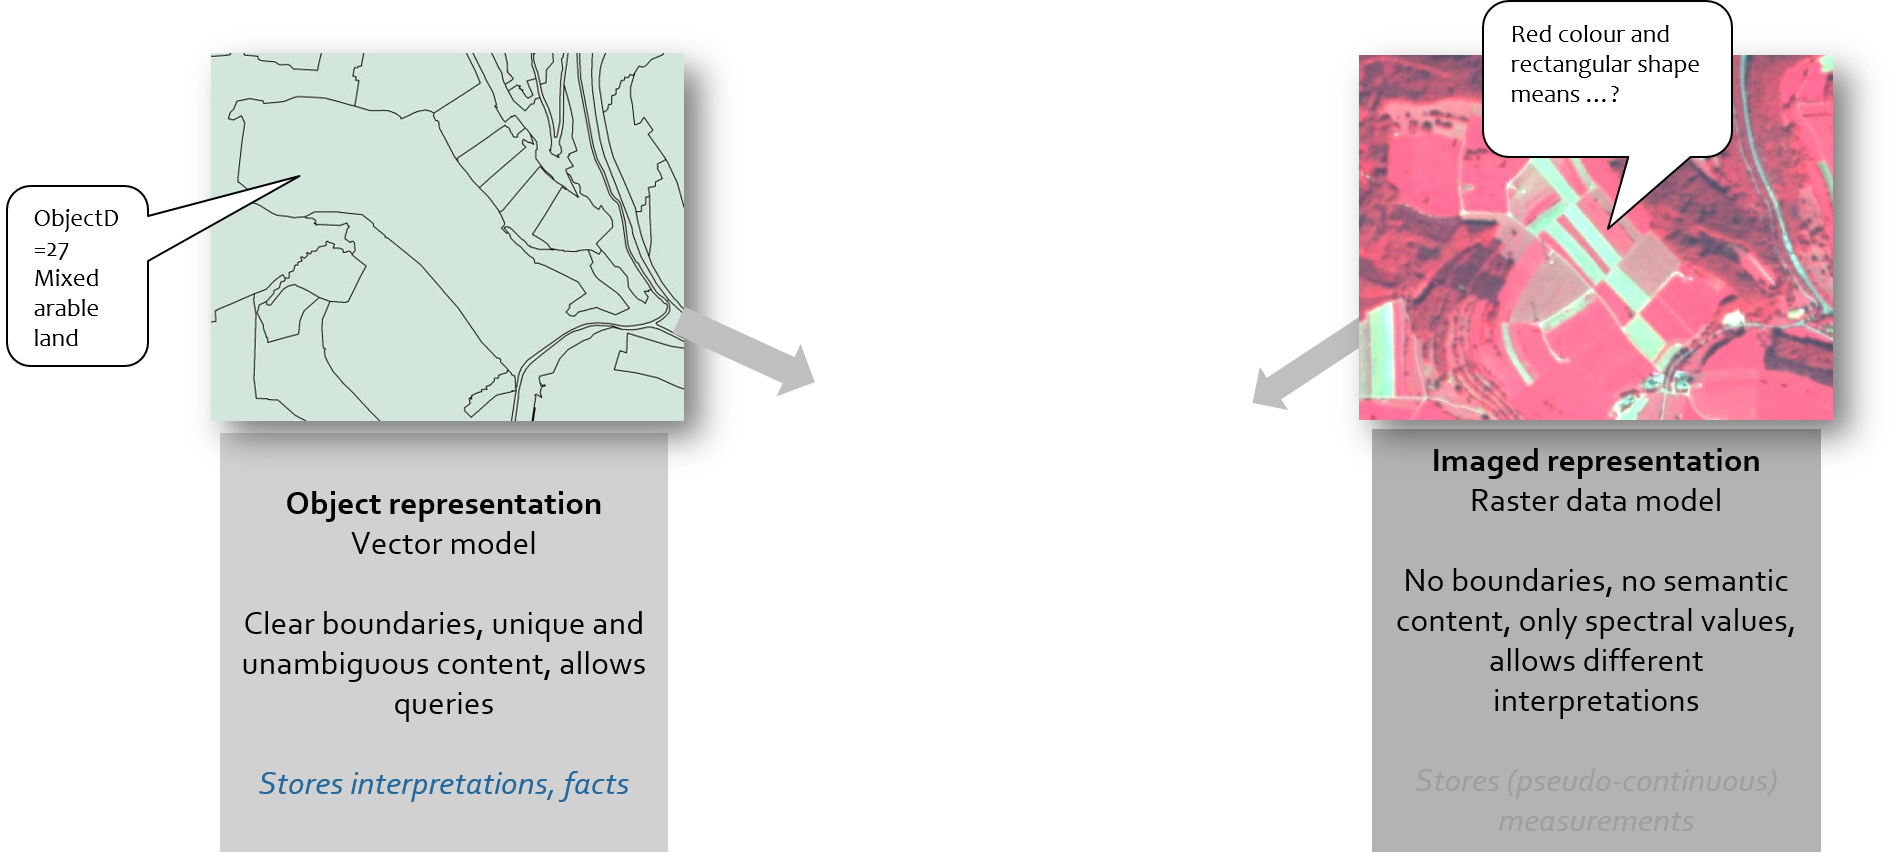
GEOBIA provides real-world representations

Space over colour?
Im image analysis, spatial properties (structure) are as important as spectral properties (colour). In vision, spatial information even typically dominates colour information (Matsuyama and Hwang, 1990)

Boundaries in images
Image data do not explictly contain or store boundaries. However, boundaries appear in several scales and are commonly used in human perception for image understanding. Boundaries can be extracted from image data using image segmentation techniques.
Real-world objects on images
Spatial concepts are inherent in human vision - like context and relationships between image components / objects / texels any visual image interpretation relies heavily on these concepts. In automated remote sensing image analysis such approaches exists for many years, but usage and applicability is fluctuating
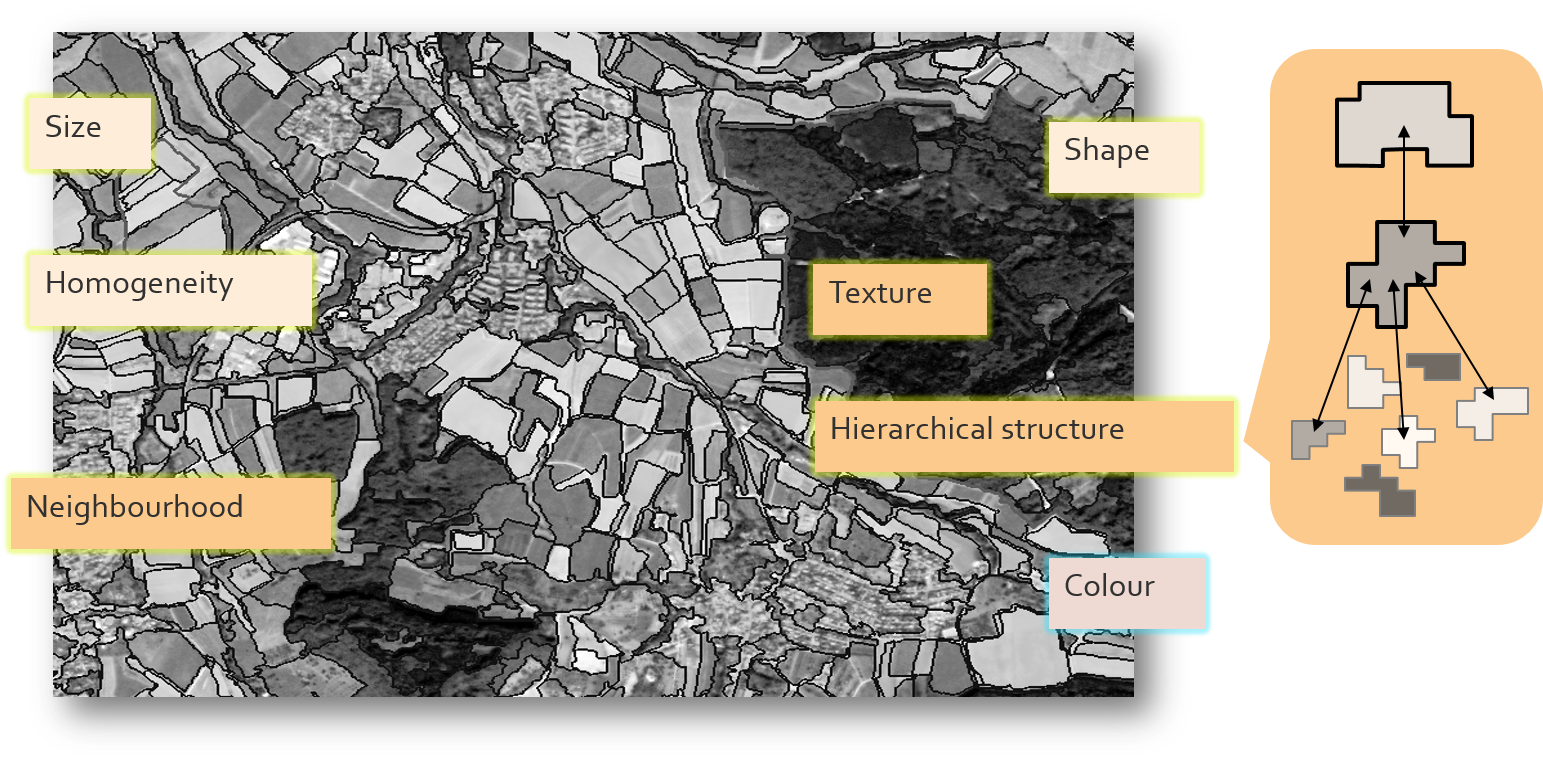
Spatial properties of objects
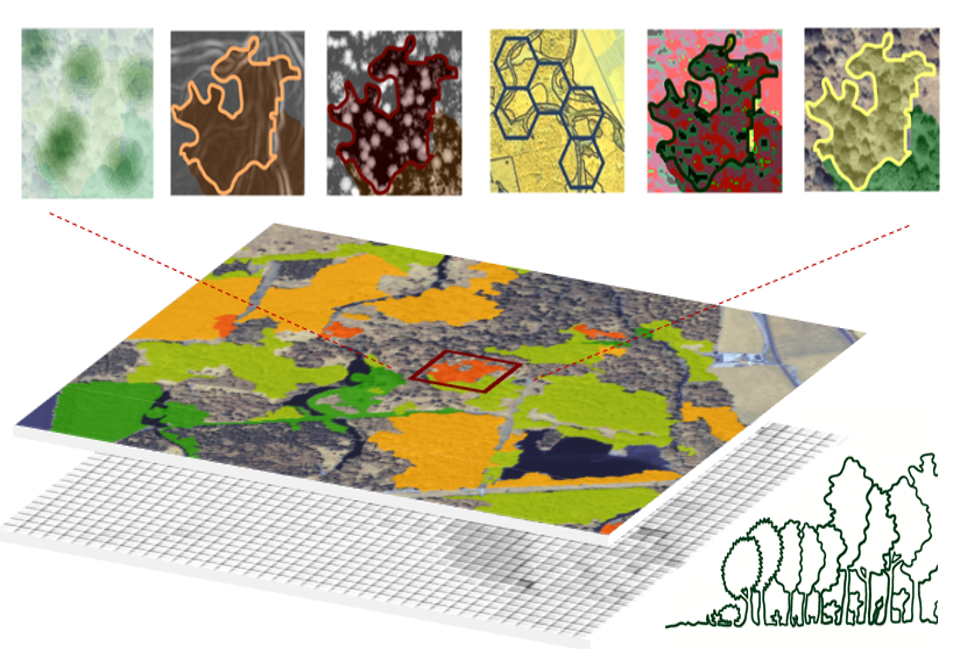
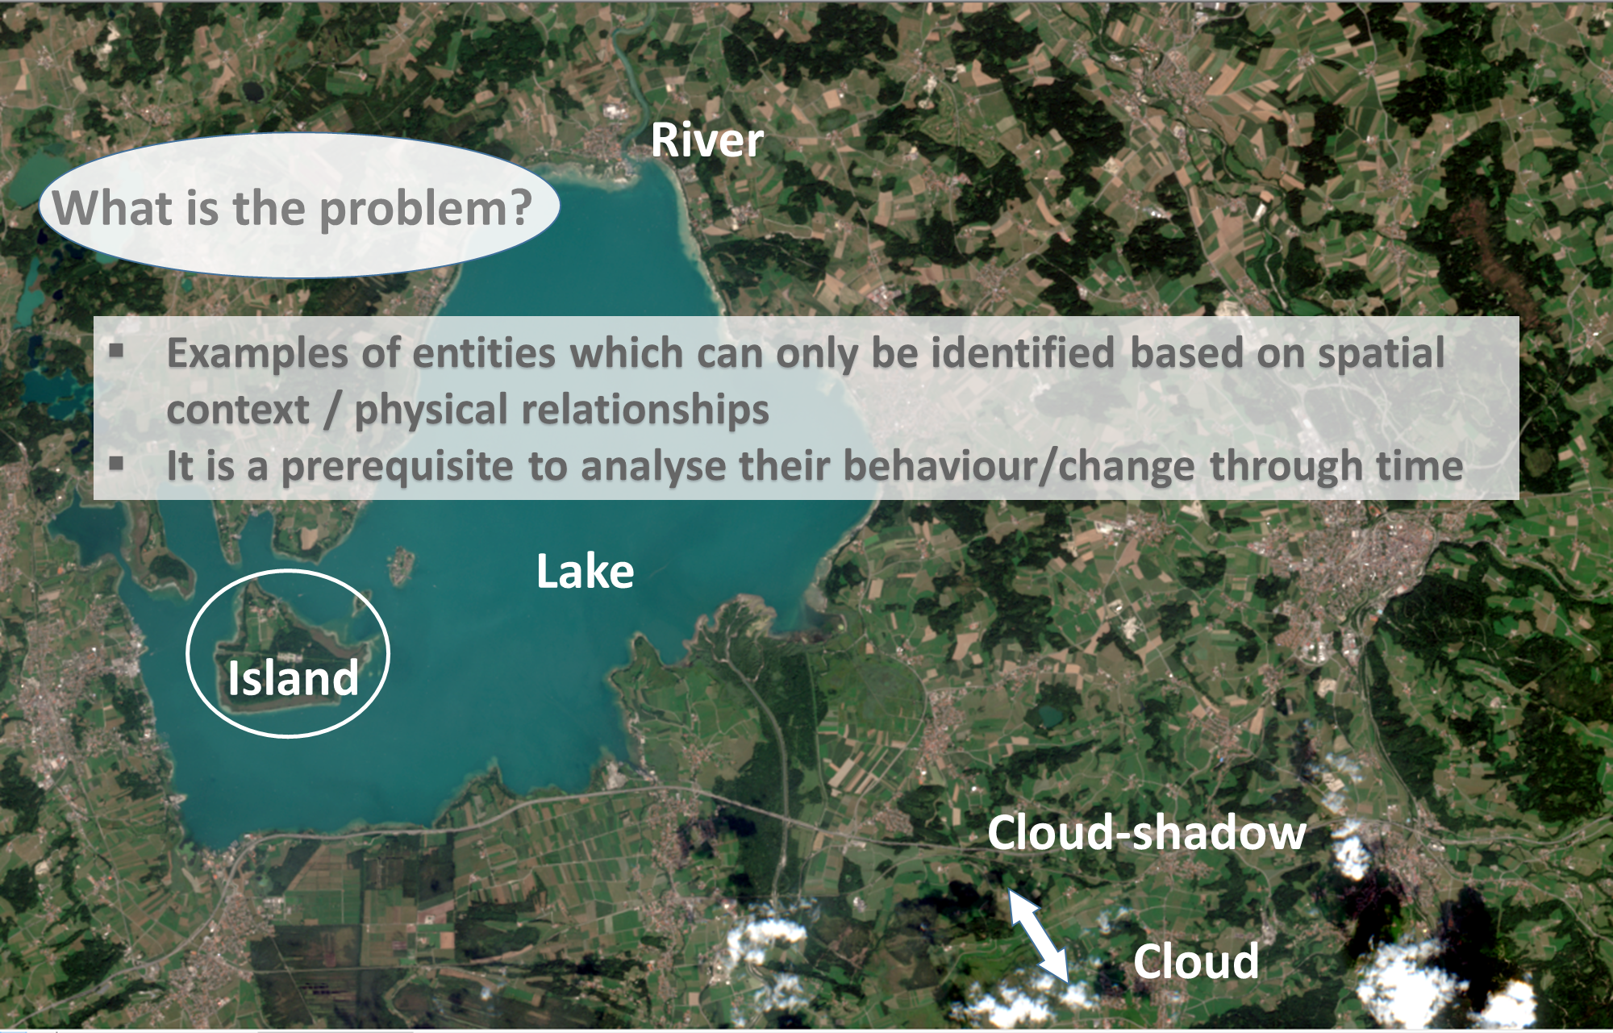
Extended set of target classes in spatial image analysis
OBIA allows to address target classes, which are spatially defined. Basically, we can distinguish between two groups, form-defined classes (e.g. lake or river) and spatio-relational classes (context-related objects such as an island, an urban park, or composite objects such as a residential area).
Overview spatial image analysis - from image to information
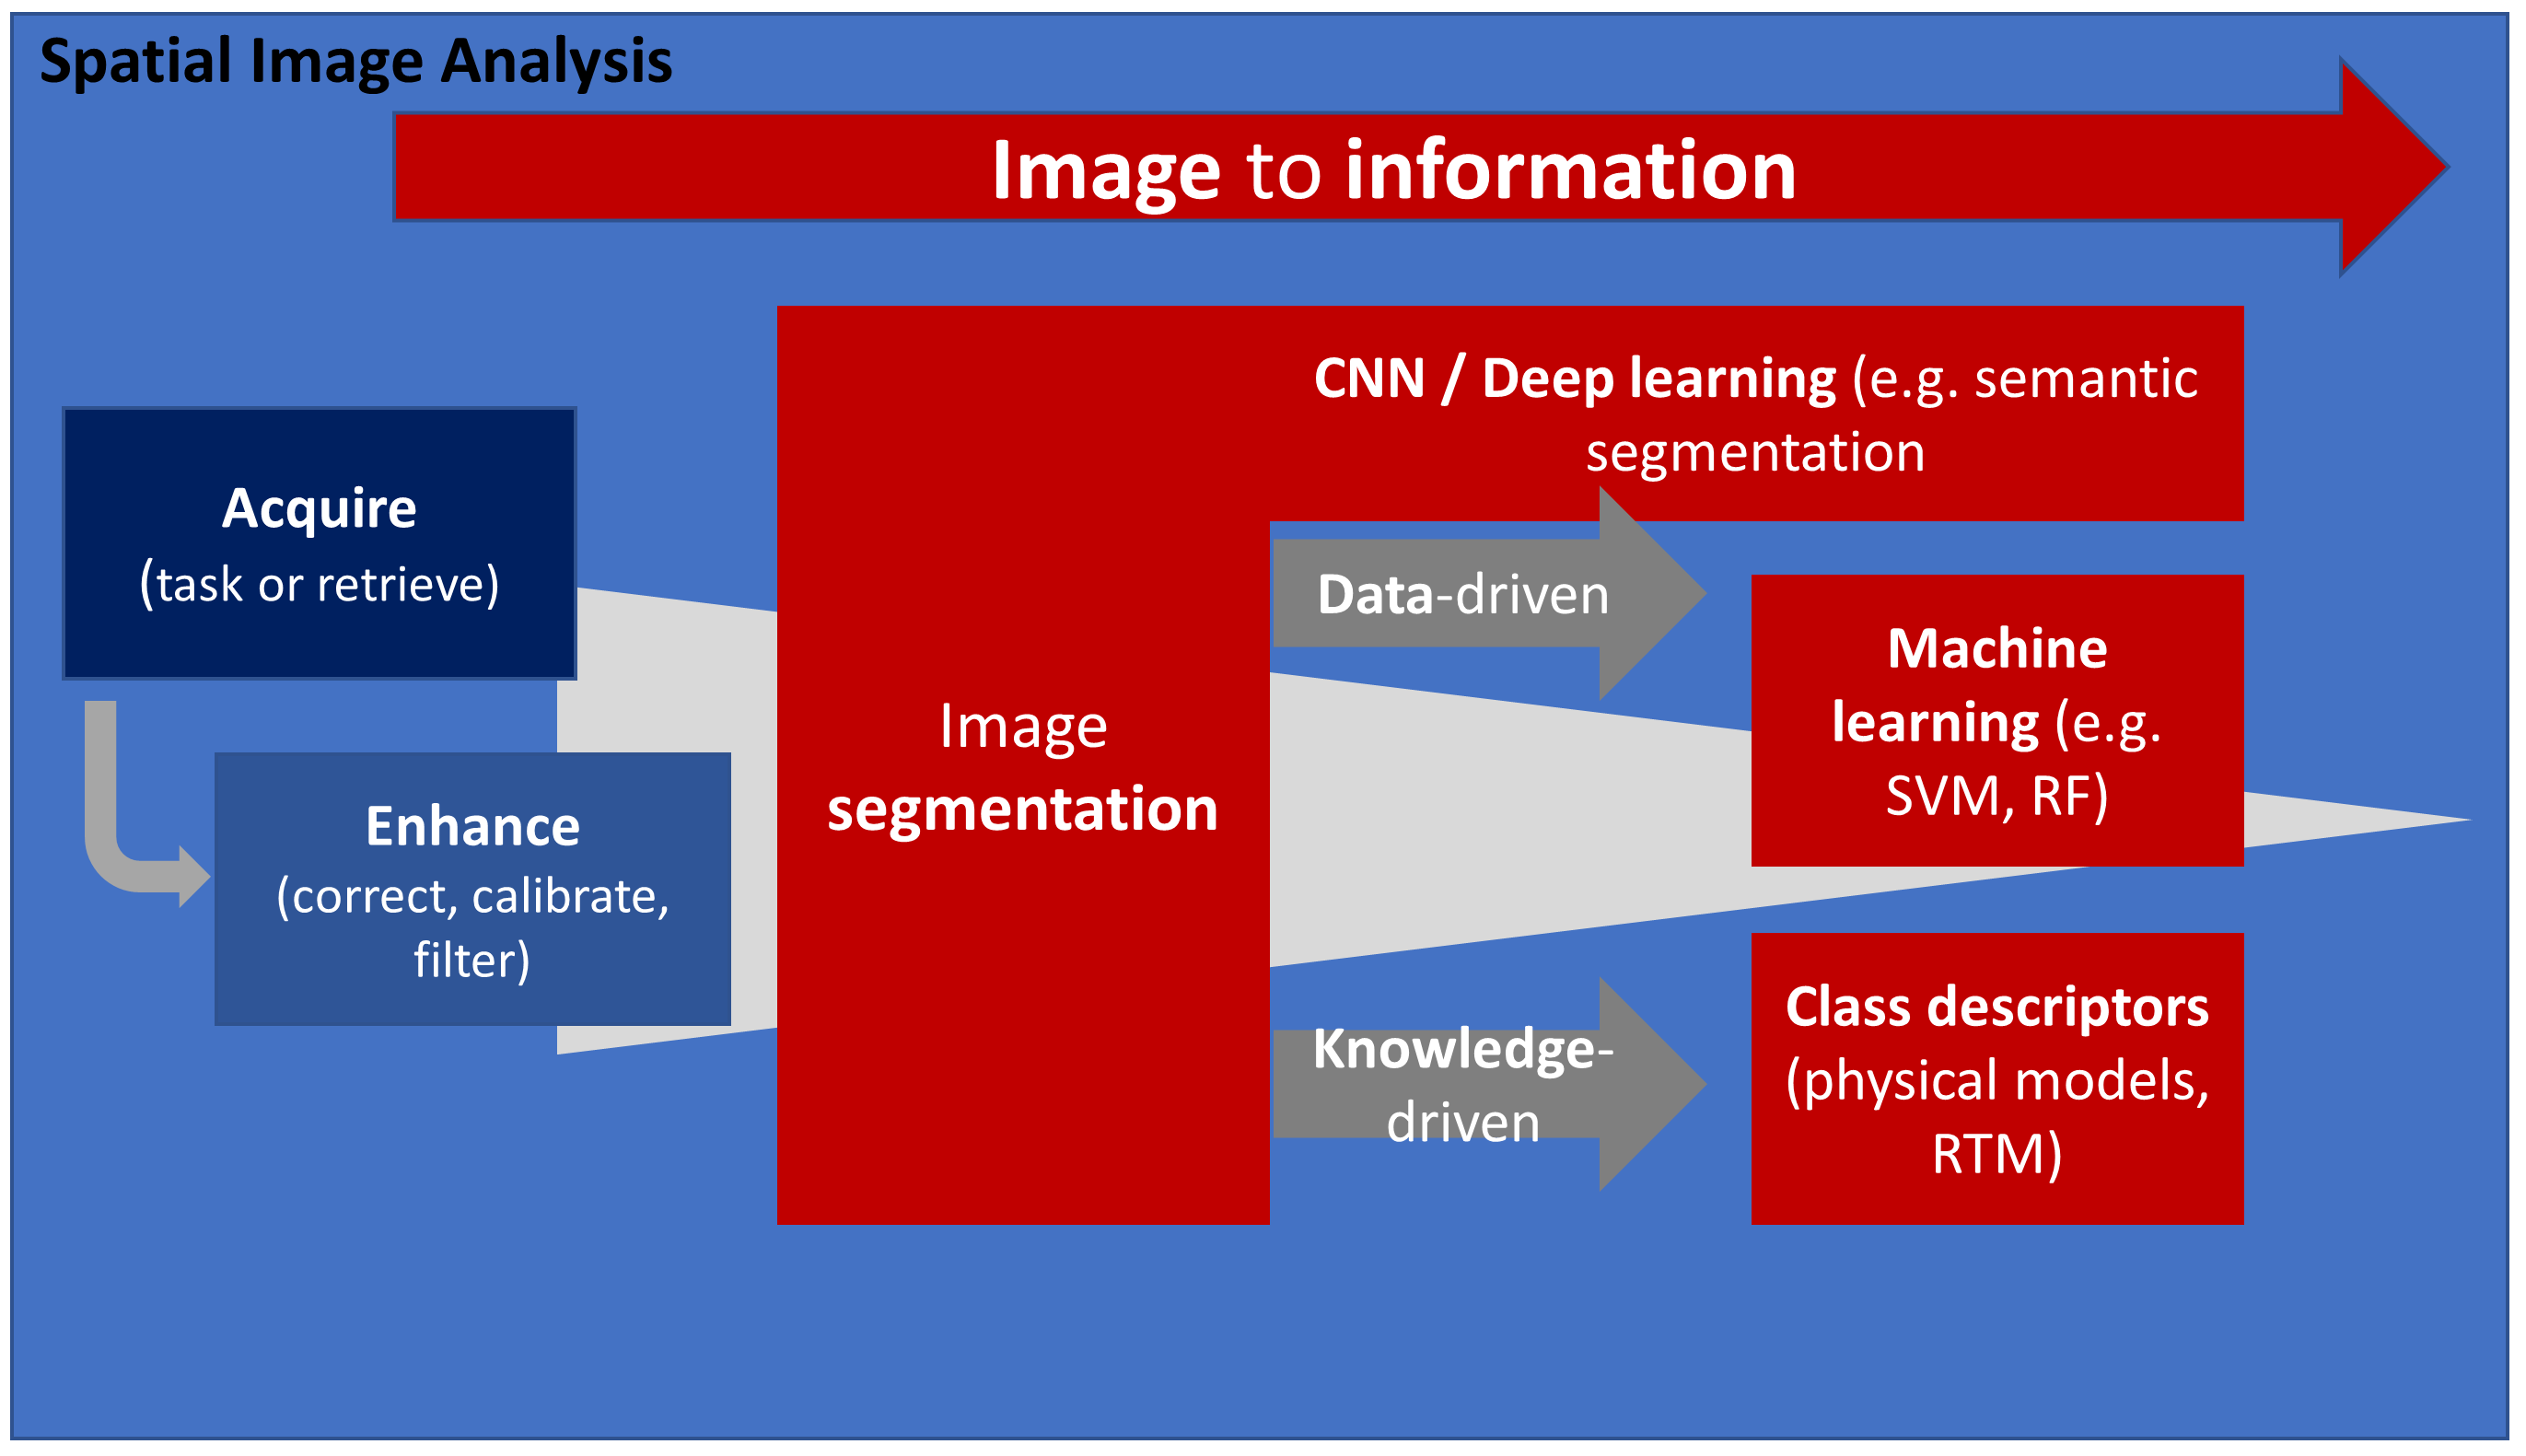
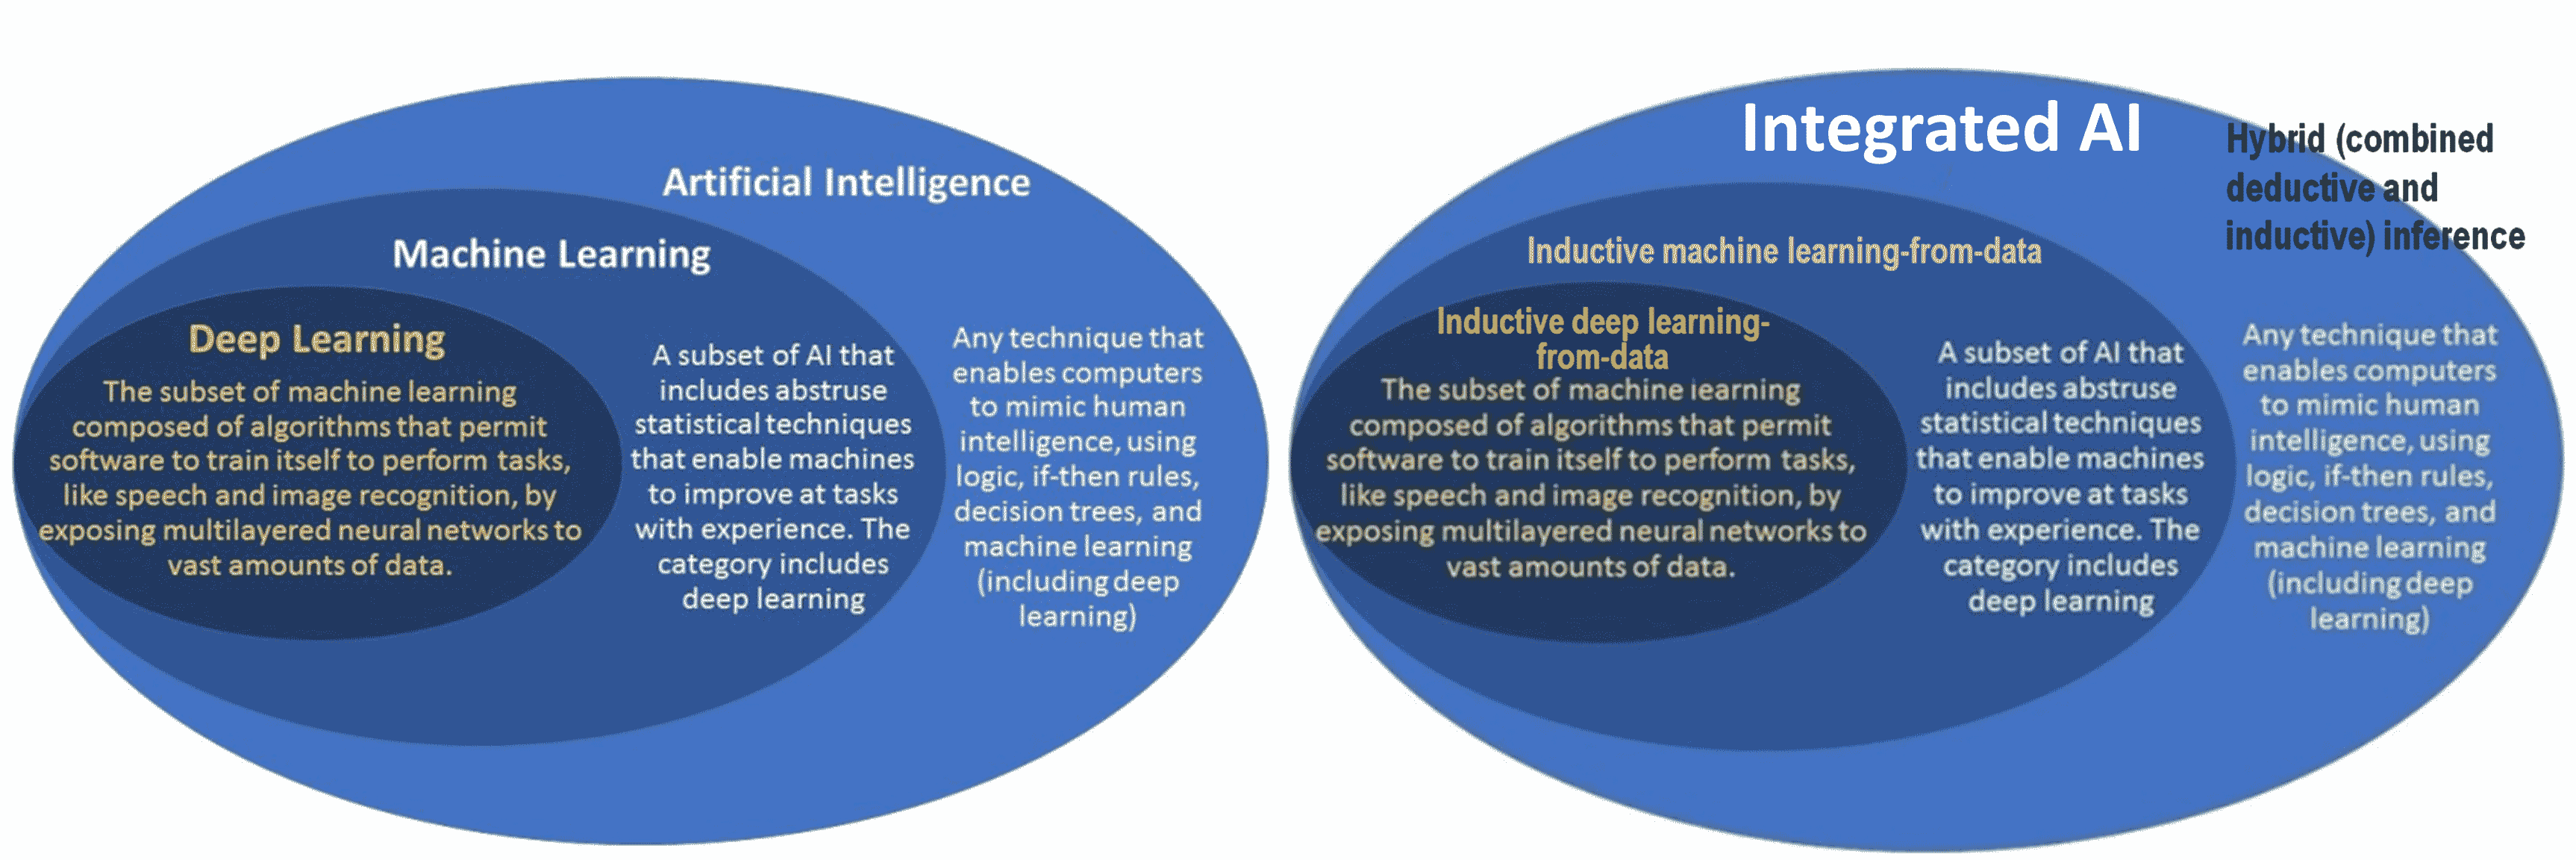
Spatial image analysis in AI
[2] Regions and image objects
Spatial auto-correlation
According to Tobler's First Law of Geography (which states that "near things are more related than distant ones"), neighbouring pixels tend to be similar. Boundaries can be detected at discontinuities or gradients between these groups of similar pixels (see Segmentation below). Boundaries form objects on distinct levels (scales)
Spatial auto-correlation and grouping
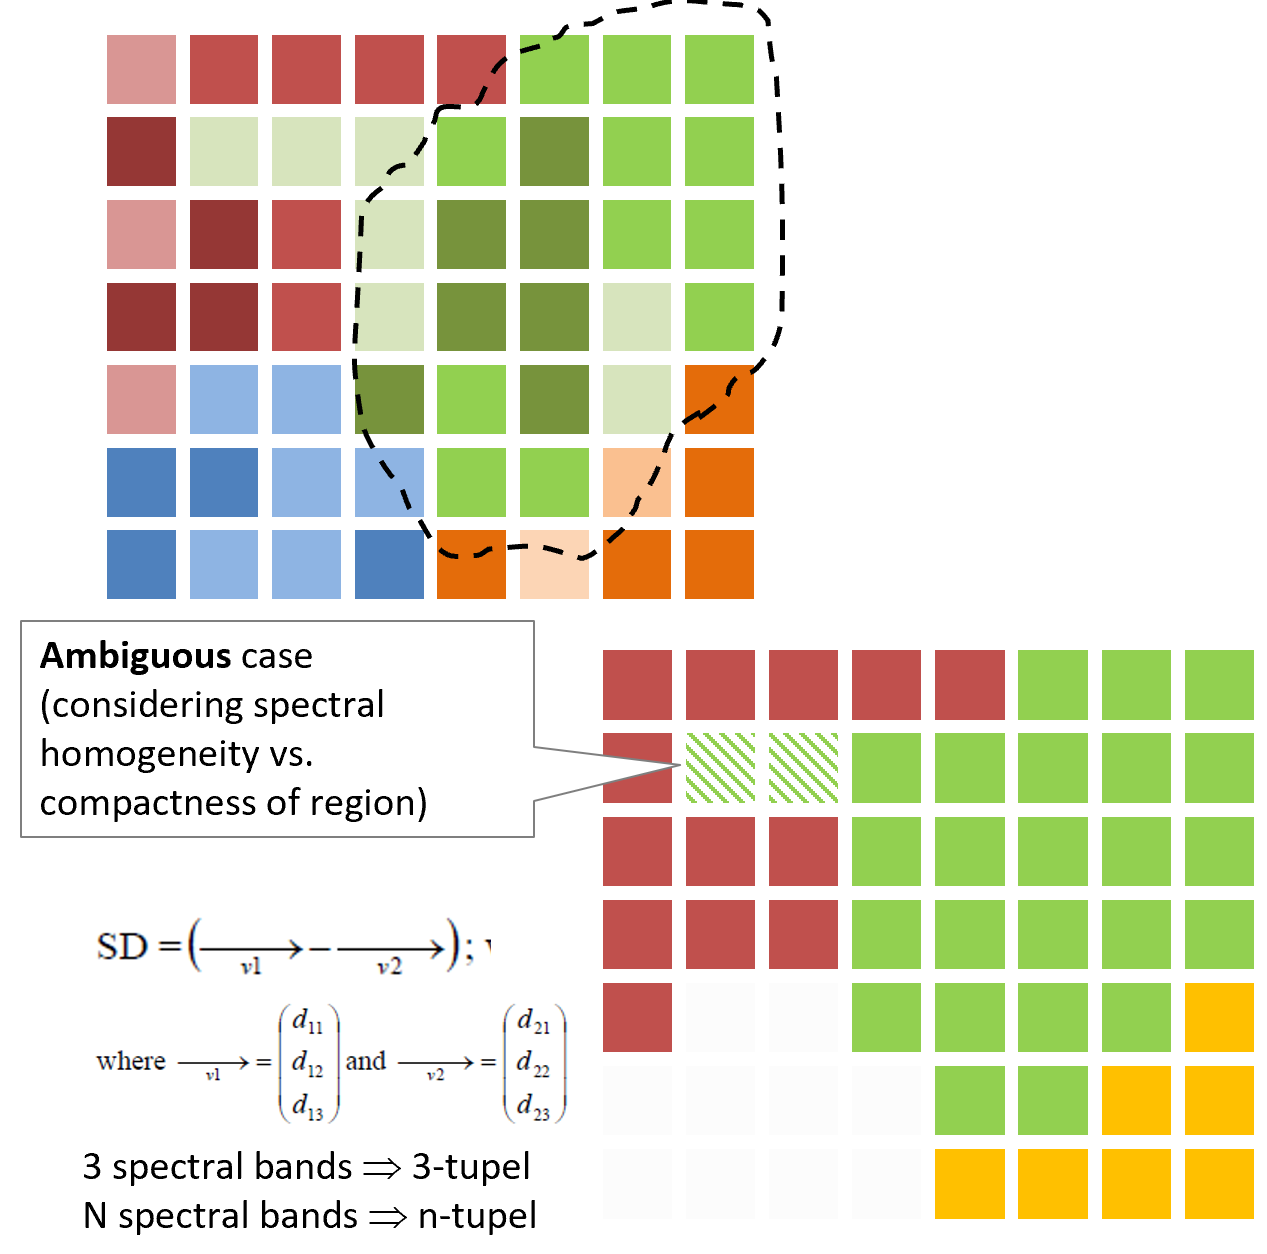
Spatial auto-correlation is a key spatial principle in image analysis. We rely on this principle when grouping pixels according to their similarity. Without spatial autocorrelation the number of grouping options would be arbitrary. However, there is also ambiguity in the grouping process.
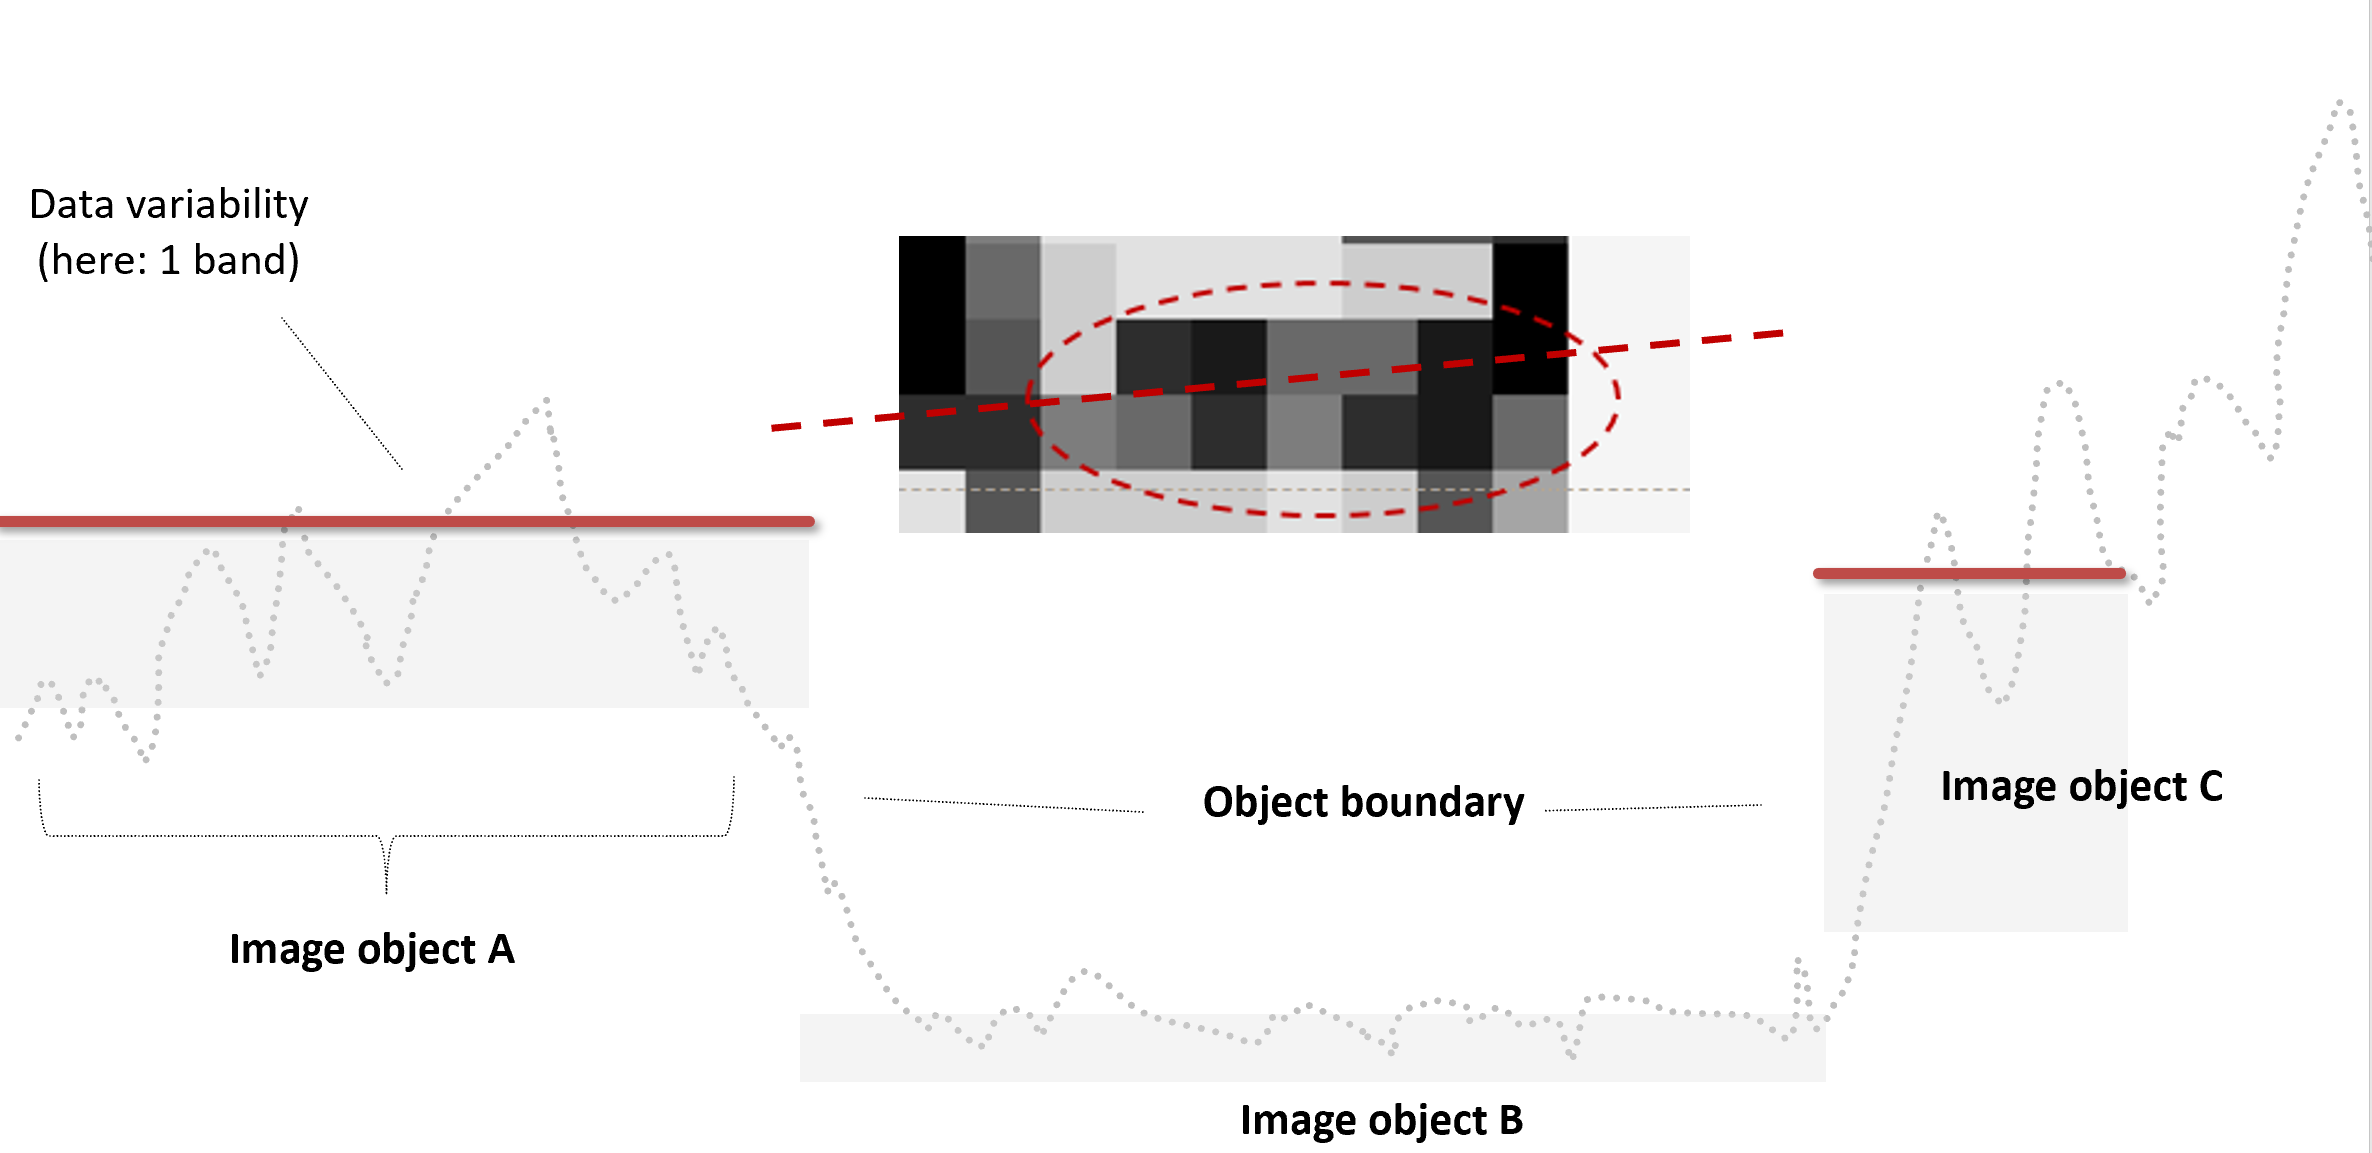
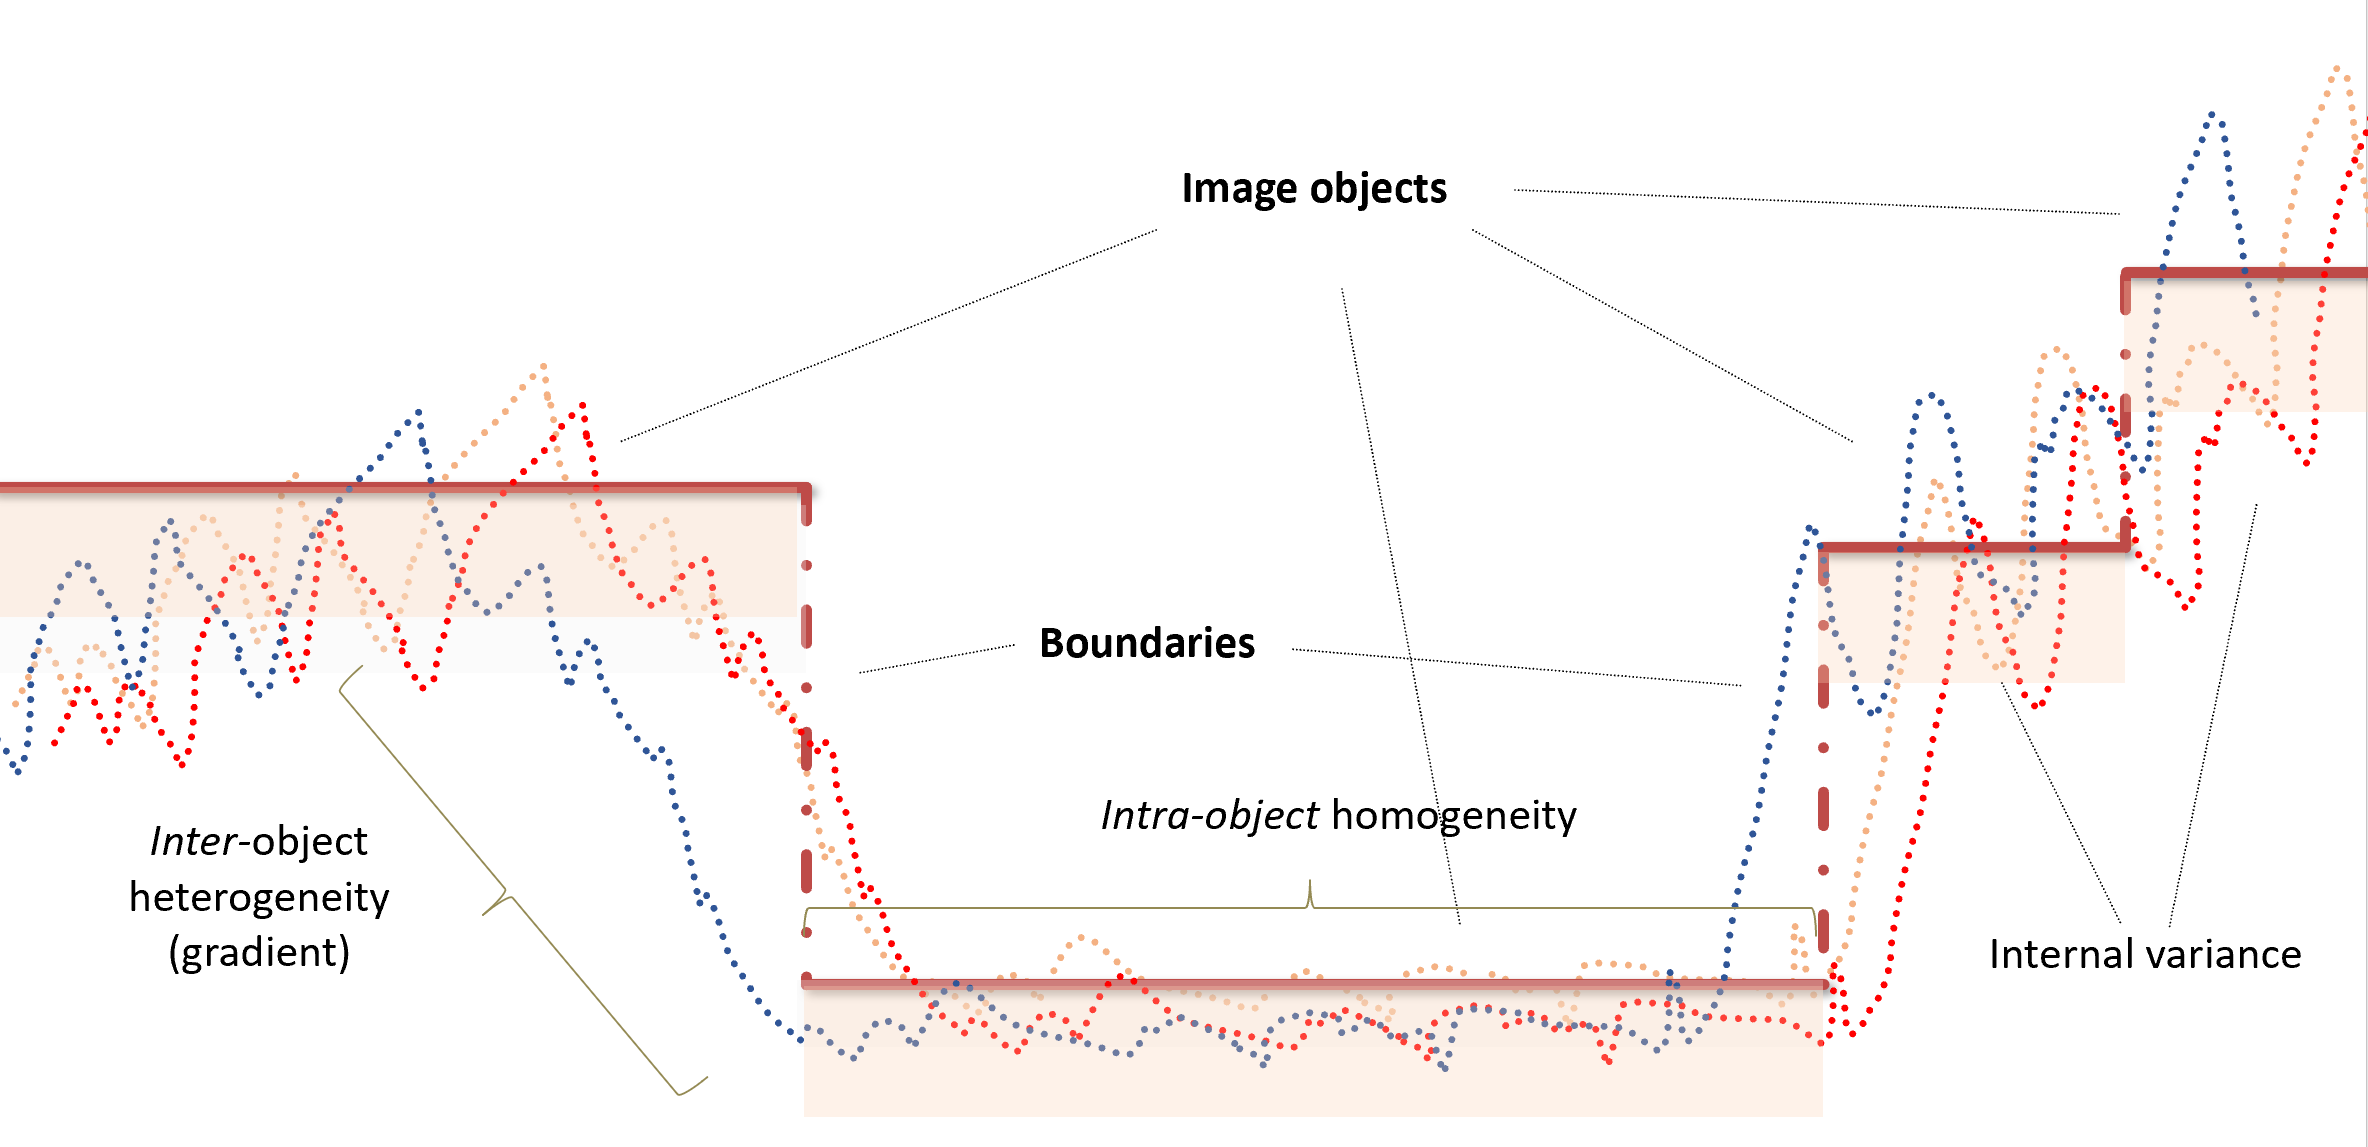
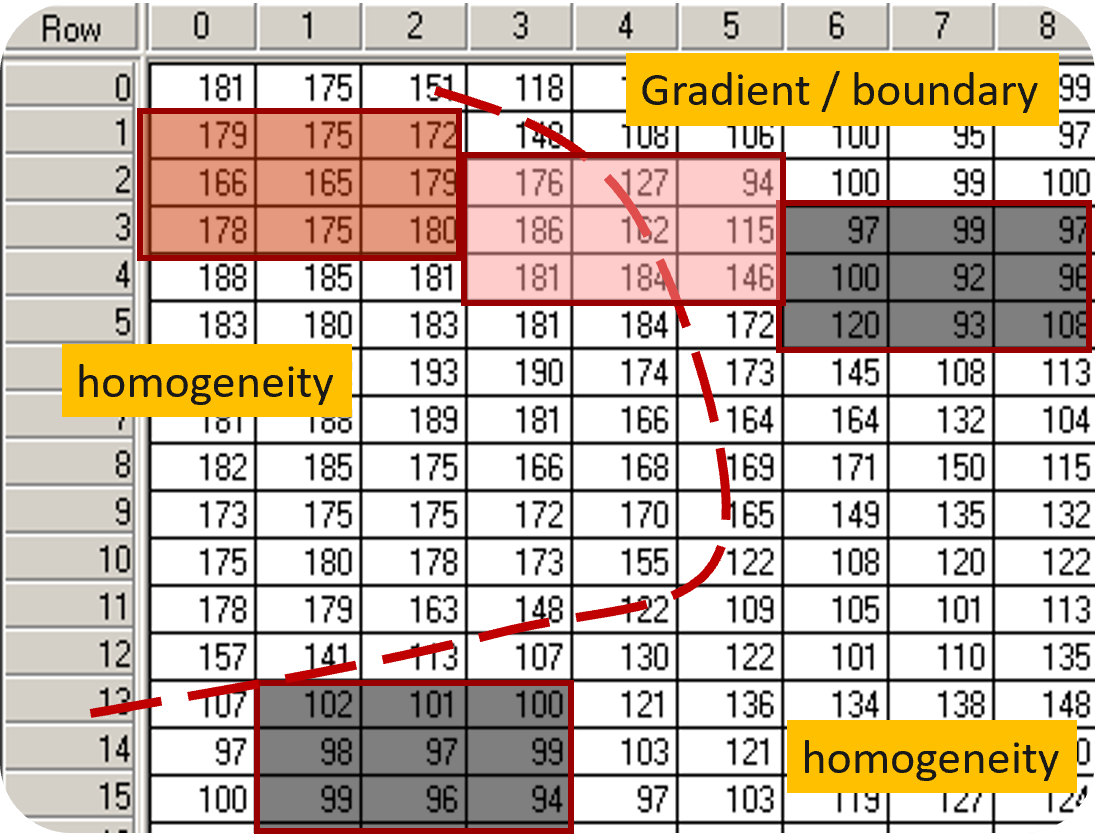
Spatial auto-correlation and boundaries
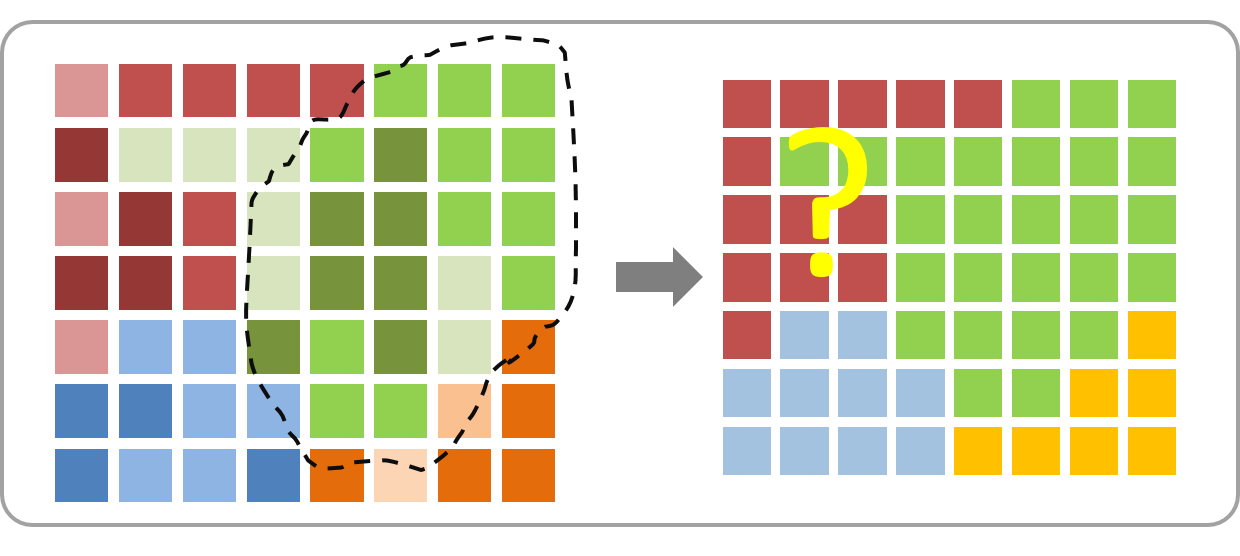
Regions
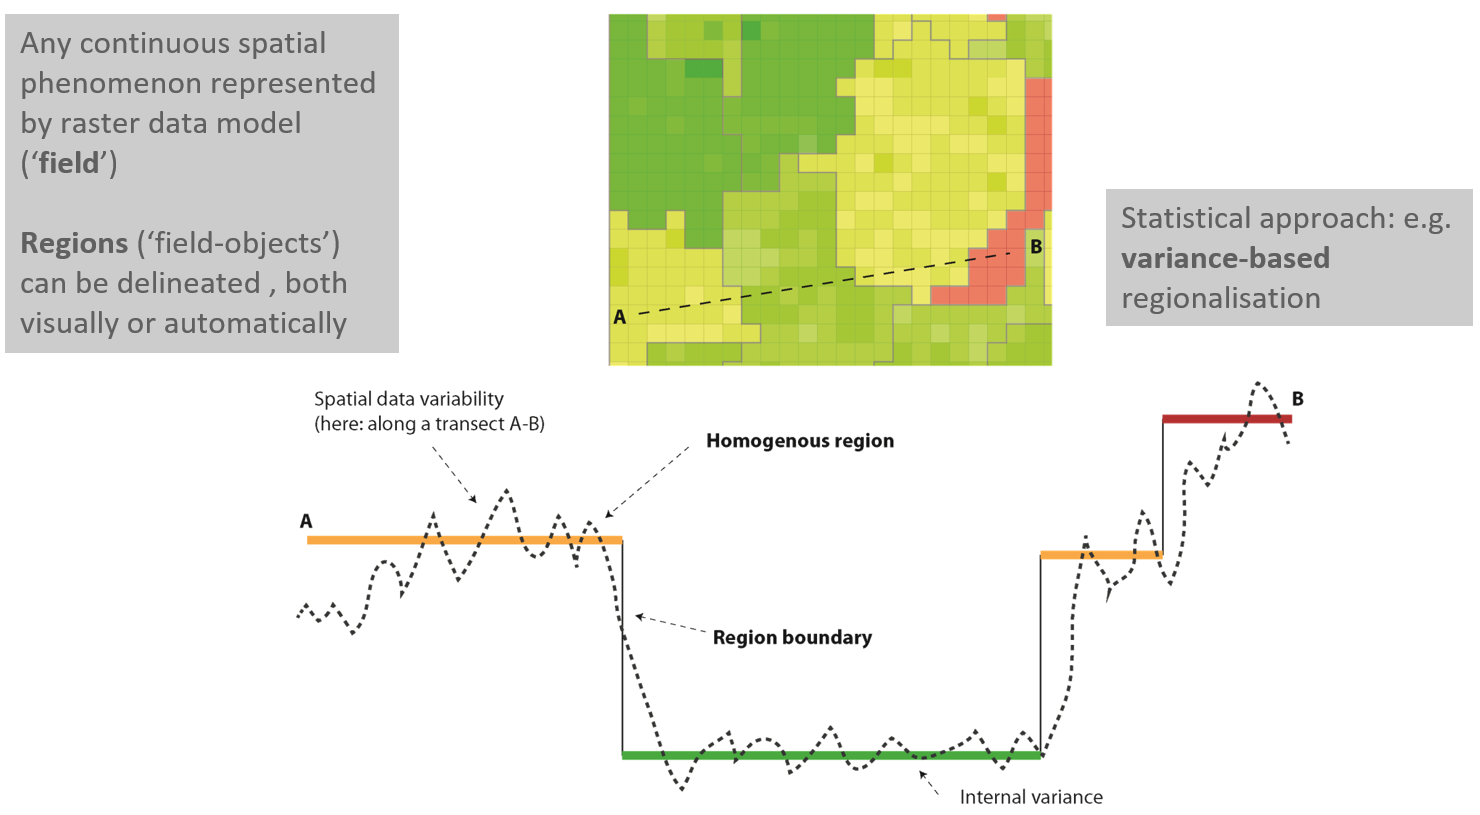
- Region = a spatially contiguous area with common attributes or uniform behaviour (internal ‘homogeneity’)
- Regionalisation = spatial classification, i.e. classification under spatial constraints (contiguity of an attribute in space)
- Why does it work? Principle of spatial auto-correlation (“1st law of Geography”, W Tobler, 1970)
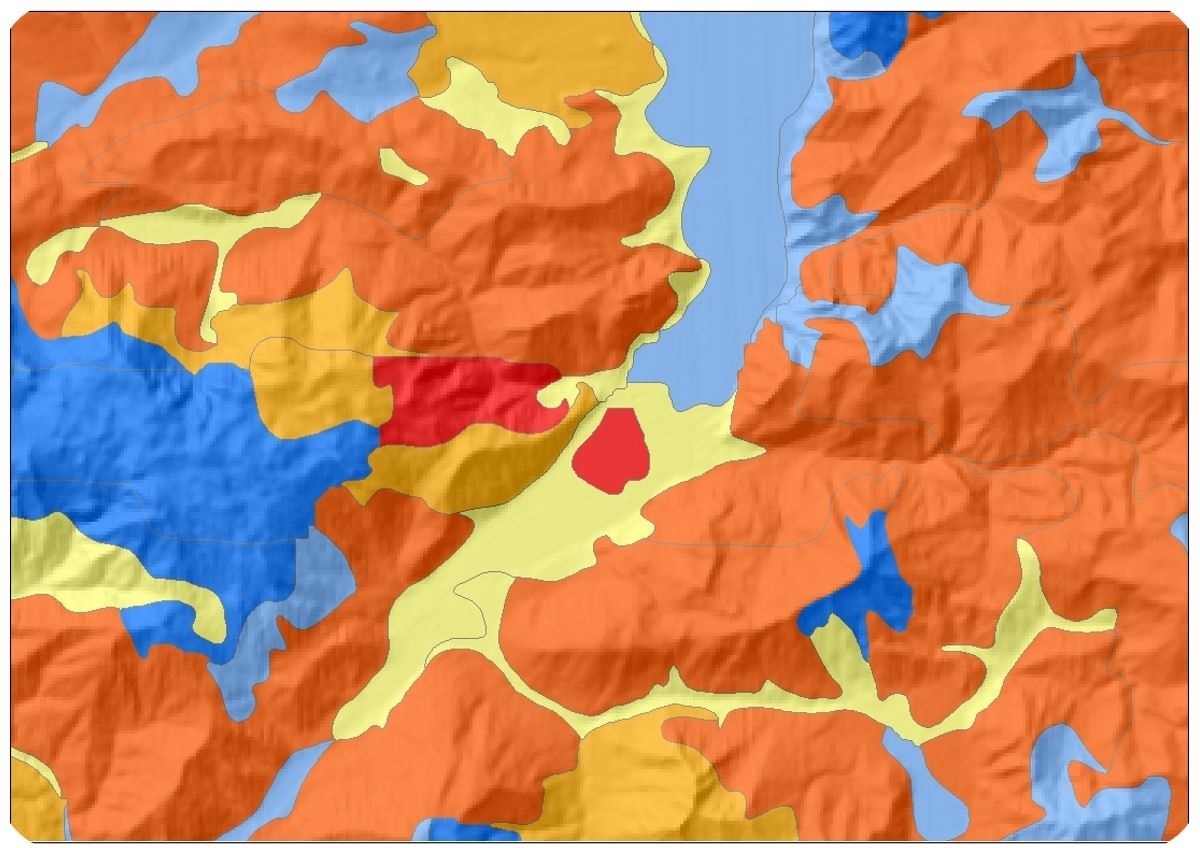
Image Objects
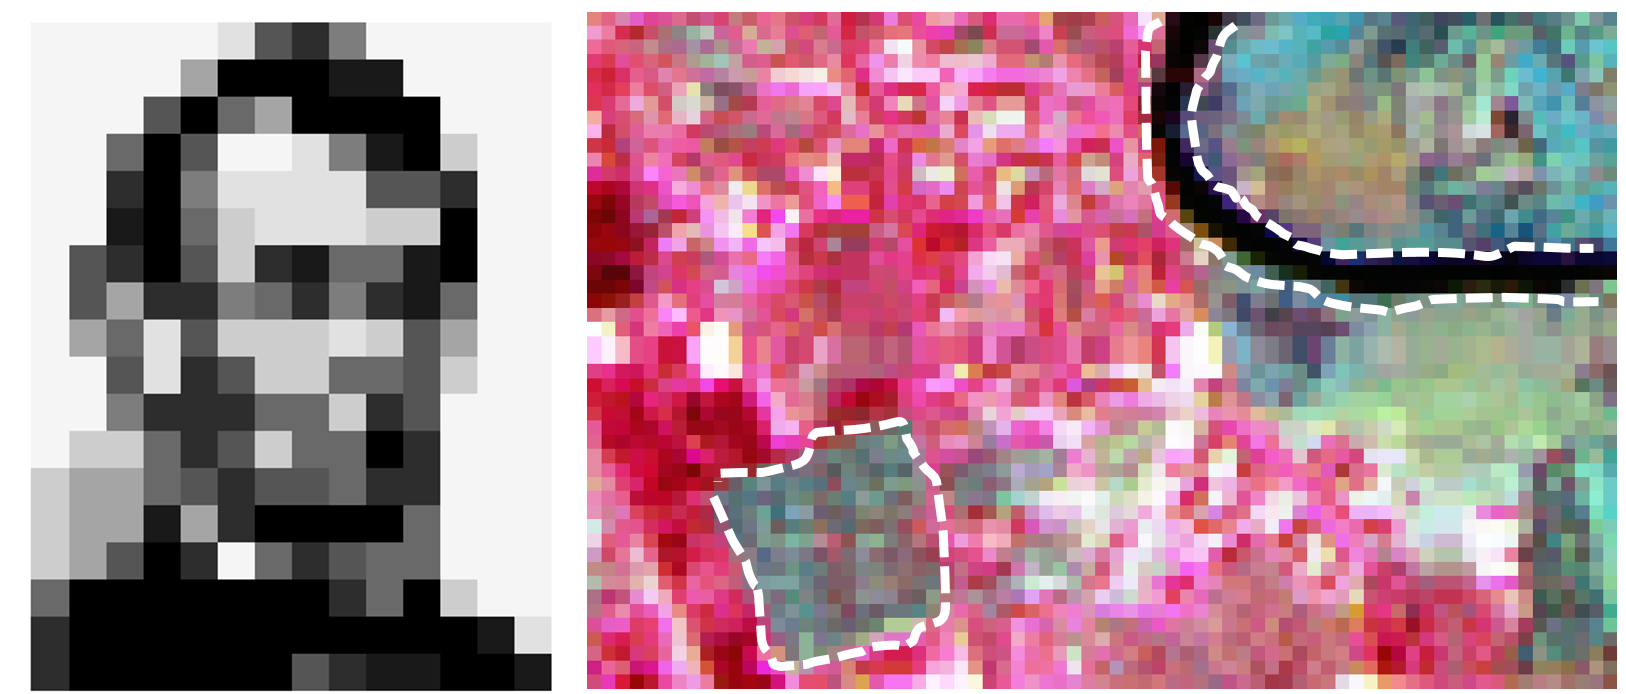
Image Objects
|
|
What means homogeneous?
not a trivial task...
- Challenges in generating regions
- Defining Homogeneity criterion H
They need to be spatially coherent
They do not exist a priori
Variance* of pixels within a region
Spectral distance (SD) of pixels
Vectors in n-dimensional feature space
*as one (statistical) measure to operationalize homogeneity
[3] Multispectral Segmentation
Principles
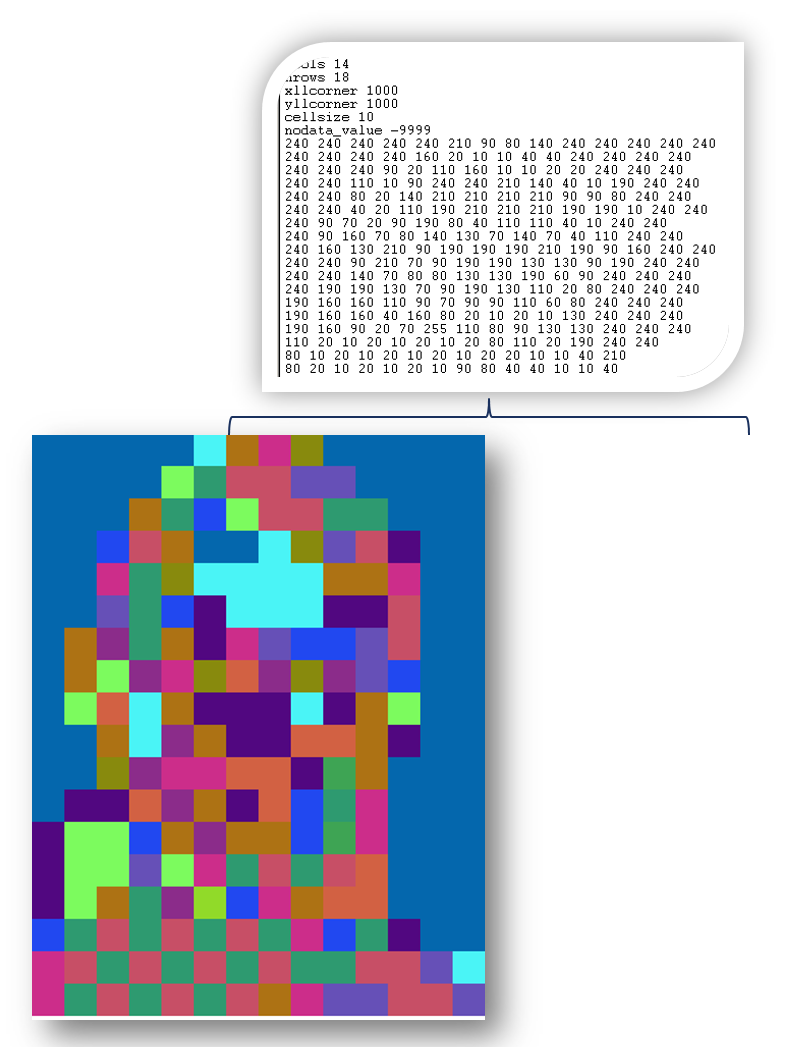
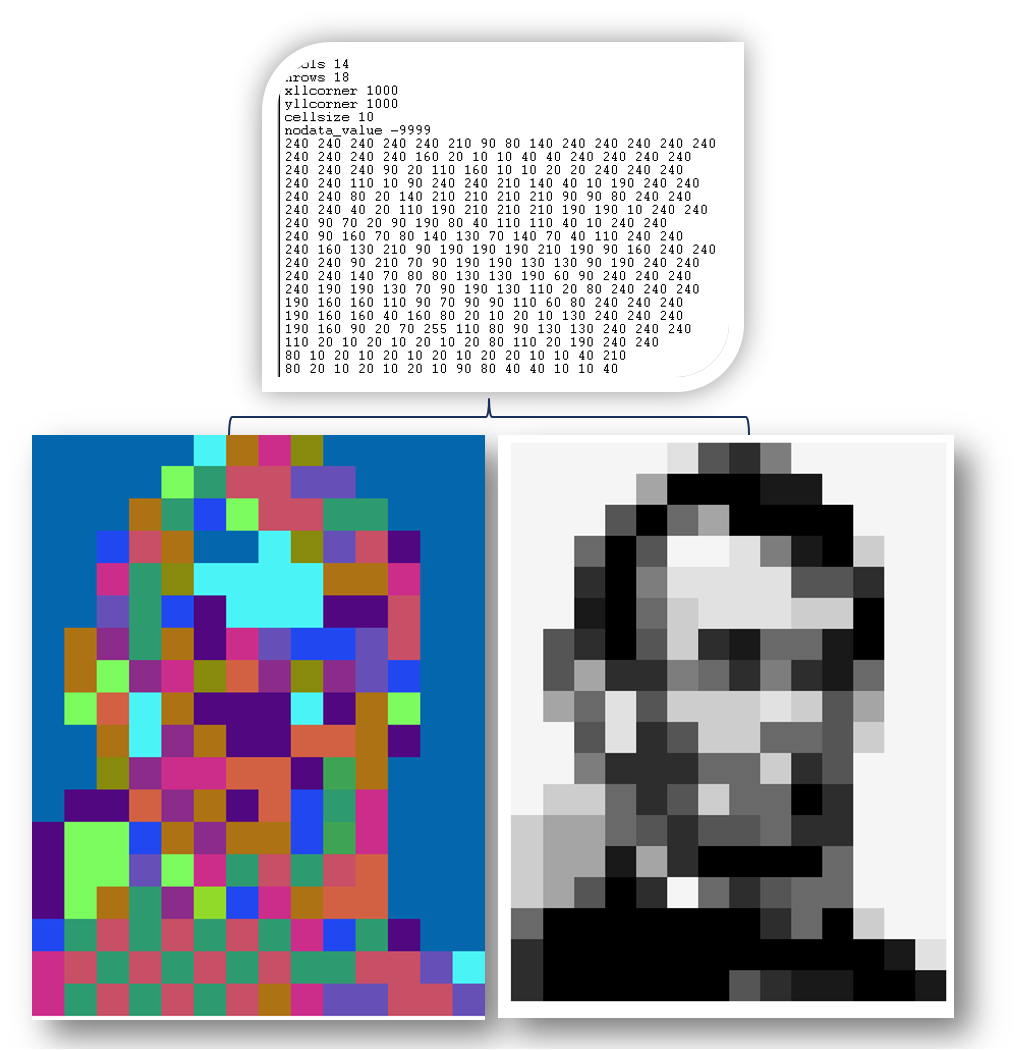
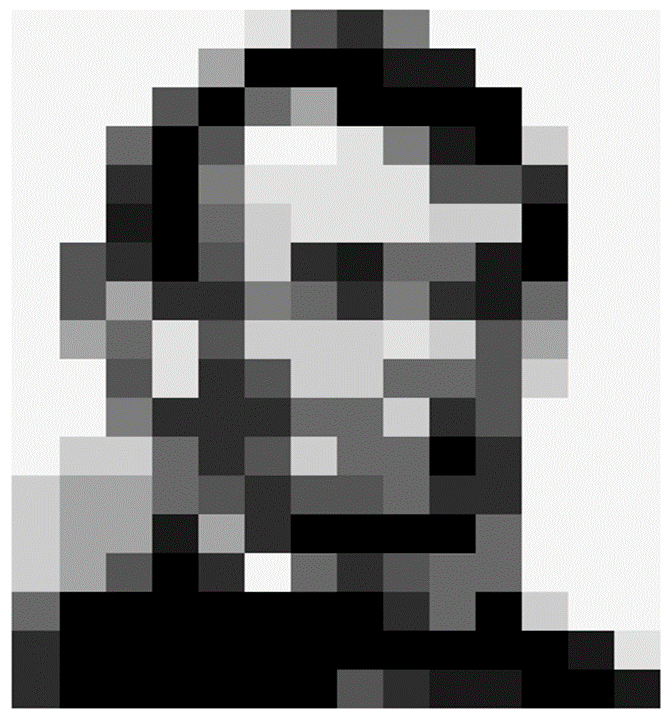
Which image objects are we able to perceive?
- From 252 digital numbers (14 x 18 image matrix) to ‘Abraham Lincoln’ (one individual person)
What do images evoke in our visual context and our brain?
Grey-scale Segmentation
Multispectral Segmentation
Segmentation Challenges
Conceptual boundaries in imagesFiat boundaries, according to convention, expertise, etc.
See lesson “Class modelling”
| |
Segmentation Challenges
Conceptual boundaries in imagesComplex classes, often defined by spectrally heterogeneous, but functionally homogenous units Segmentation rarely provides these units directly Cyclic approach needed (class modelling) Expert-based (object validity)
| |
Image Segmentation
Local pixel neighborhood
- Spatial autocorrelation among pixels
- neighbouring pixels tend to have similar values
- But not everywhere!
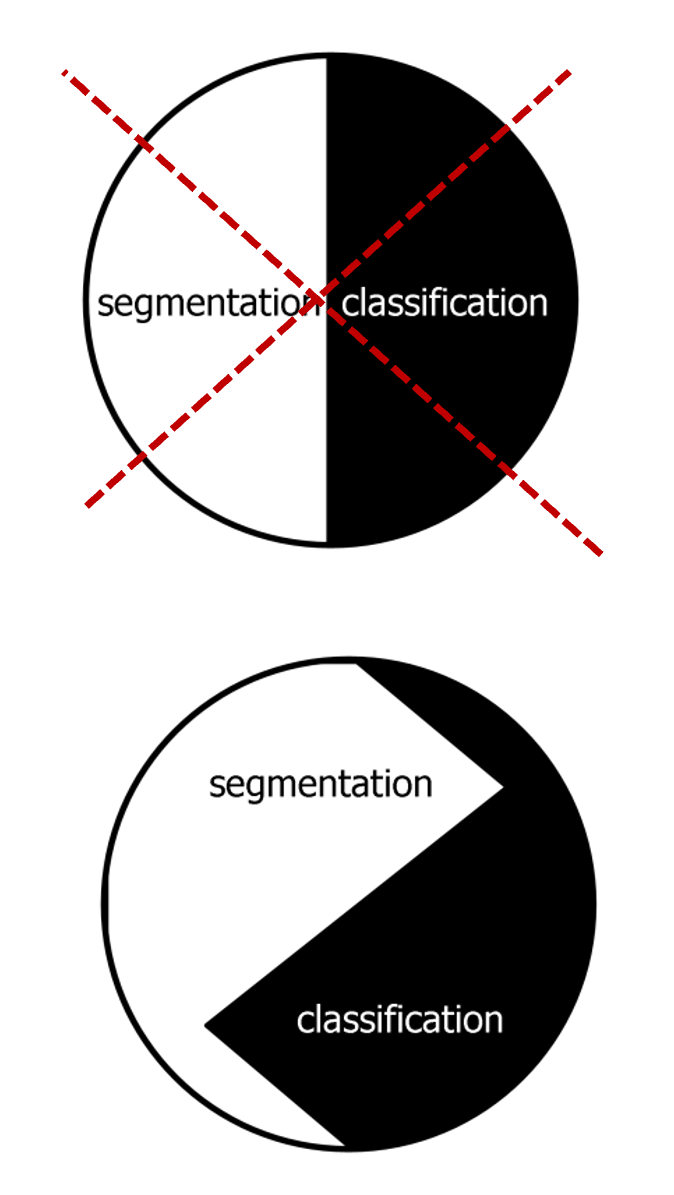
Segmentation and classification
Two interrelated methodological pillars (Lang 2008)
(1) segmentation / regionalisation for nested, scaled representations ('object scape')
- Segmentation of different types of continuous data
- Optimizing segmentation (algorithms and parameterization) in terms of usability, theoretical foundation, etc.
- Systematic comparison of segmentation results
(2) rule-based classifiers based on spectral and geometrical properties as well as spatial relationships
- Ontology driven classification, advanced sets of target classes
- Process of OBIA not necessarily sequential (i.e. as described here), rather sequential, iterative (class modelling)
- Smooth transition to methods to further characterise and analyse classification results (e.g. landscape metrics)
Multi-scale segmentation
Segmentation in several hierarchical scales
scale-specific vs. scale-adapted segmentation
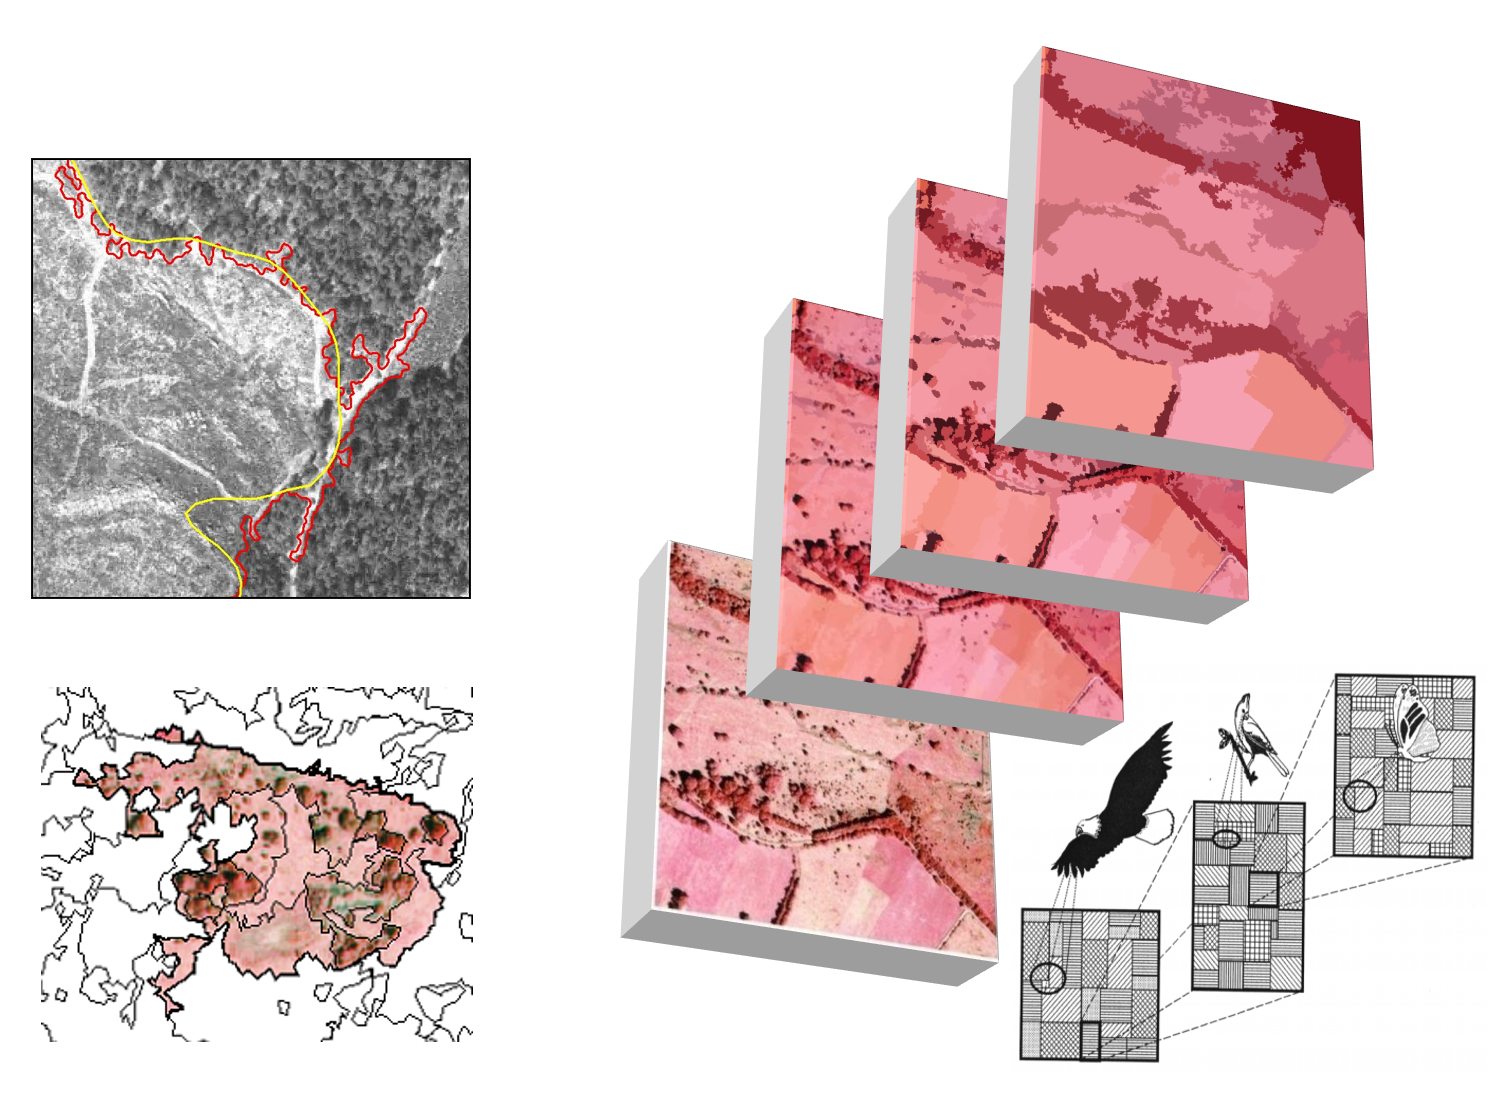
Multi-scale segmentation
Representations in various nested levels
Each object 'knows' its neighbours and hierarchical level
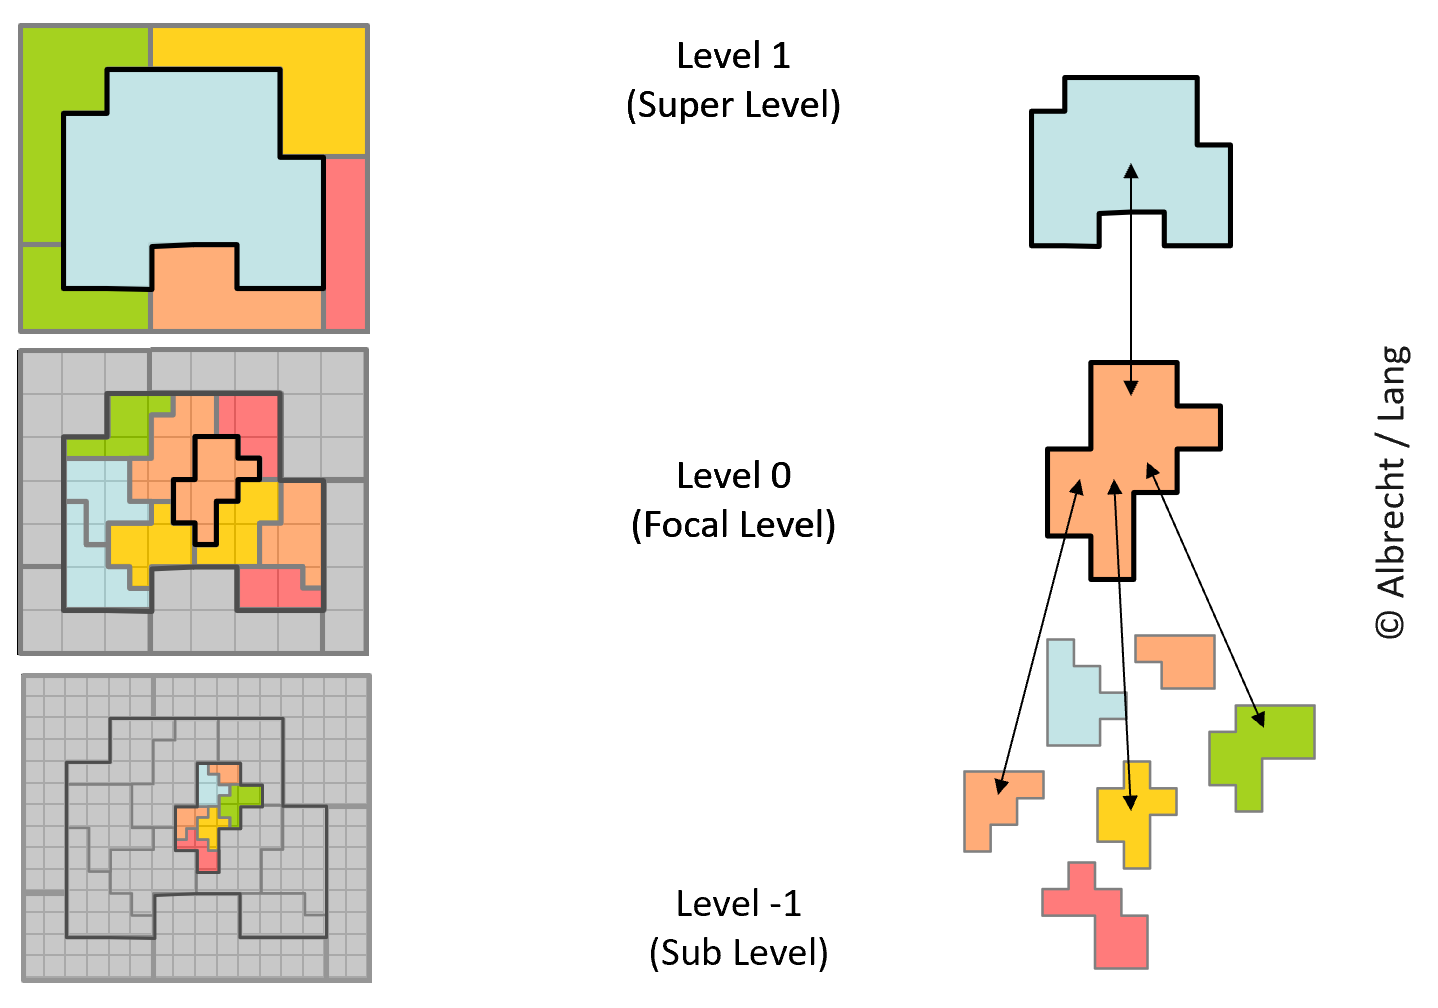
Multi-scale segmentation
[4] Knowledge representation
Why knowledge representation?
We all have a concept of “cold”, “warm”, “hot”
- In remote sensing and image analysis a lot of expert knowledge exists
- Such knowledge is implicit or explicit
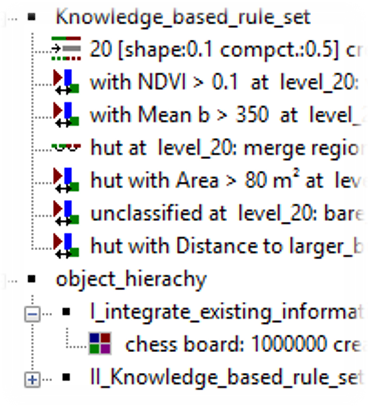
- The latter can be formalised and encoded in rules, (e.g. NDVI > 0.2 => vegetation)
What type of knowledge can be used?
Knowledge in image interpretation: visual skills are complemented by explicit knowledge, enriched by experience and training
Structural knowledge
- how concepts within a domain are interrelated
- links between image objects and real-world geographical features
Procedural knowledge
- specific computational functions, algorithms
- Encoding of structural knowledge, e.g. by a set of rules … or by a set of representative samples
Some facts we can take for granted...
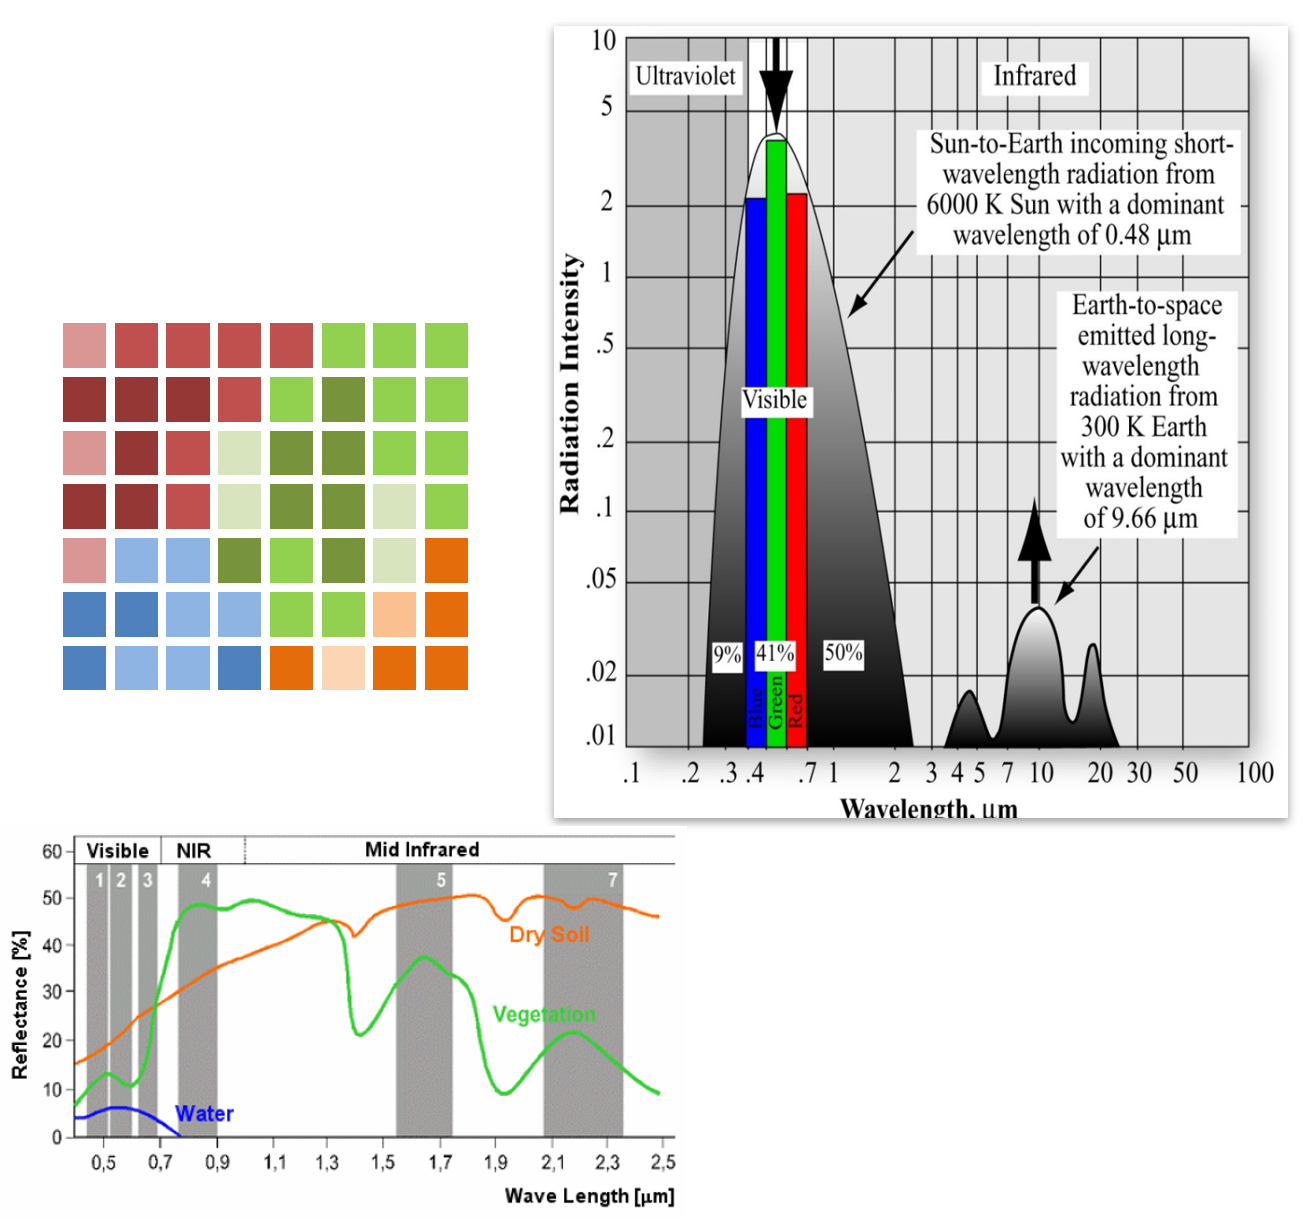
- Physical laws and principles (e.g. Stefan Boltzmann‘s Law : The hotter a body, the more energy is emitted; Wien‘s Displacement Law: The hotter a body, the shorter the wavelength of the maximum radiation)
- Different land surface types show specific spectral profiles
- Spatial autocorrelation
- ...
Others we know from experience...
Heuristics describing certain geographical phenomena are encoded in a set of rules. Rules can address all kinds of features.
Example soccer field = a special kind of grassland patch with certain size and shape.
- Grassland appears “red” in a false-colour band combination
- How does a football field look like on Sentinel-2?
- Object features (color, shape, size, etc.)
- Object-to-neighbour relationships
- Hierarchical relationships>
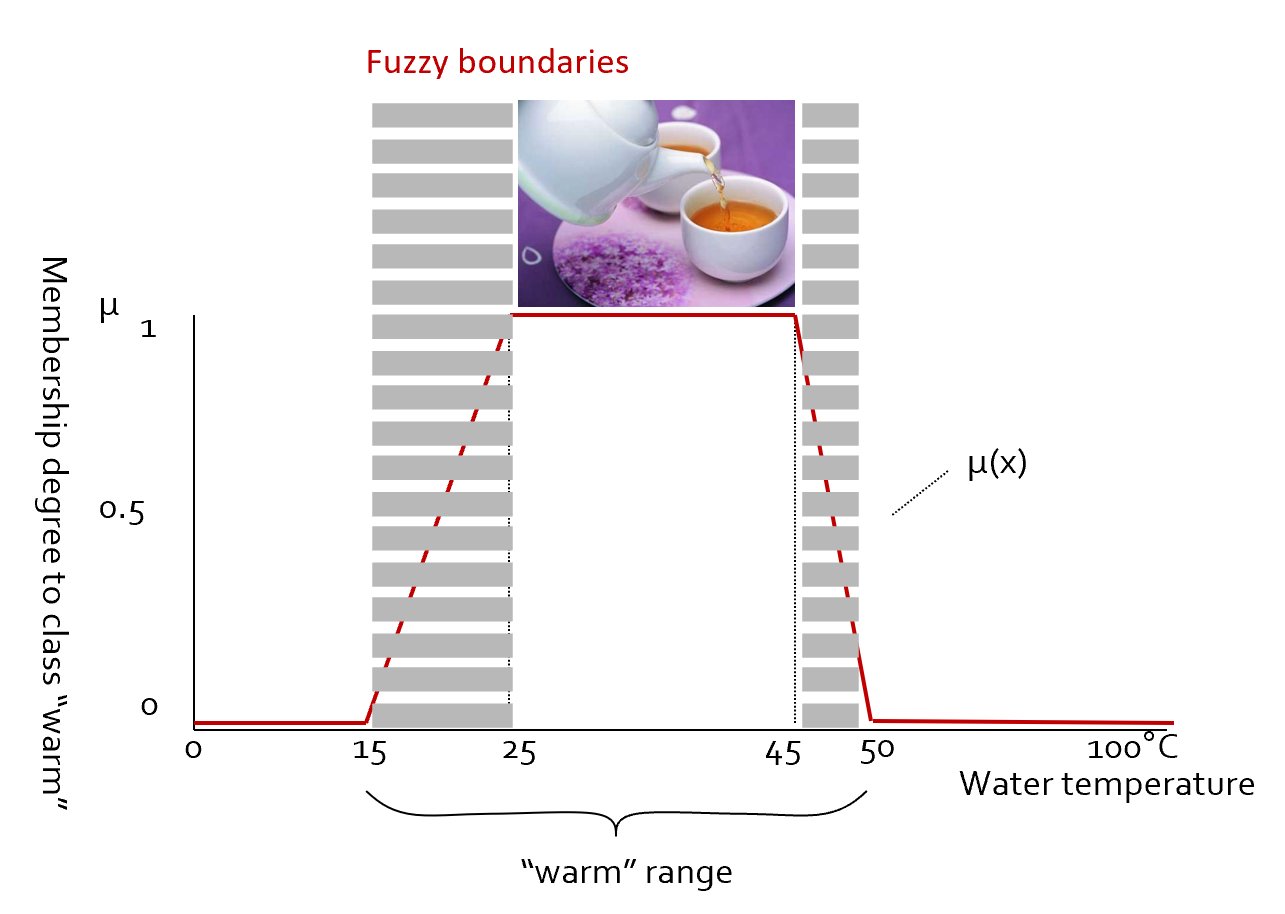
Fuzzy (rule) set
We all have a concept of “cold”, “warm”, “hot”
- We discretise a gradual phenomenon by categorizing it
- Boundaries between these concepts are not crisp
- The category under concern gets more stable with increasing ‘distance’ from boundaries
- Fuzzy sets: a way to model / operationalise vague knowledge
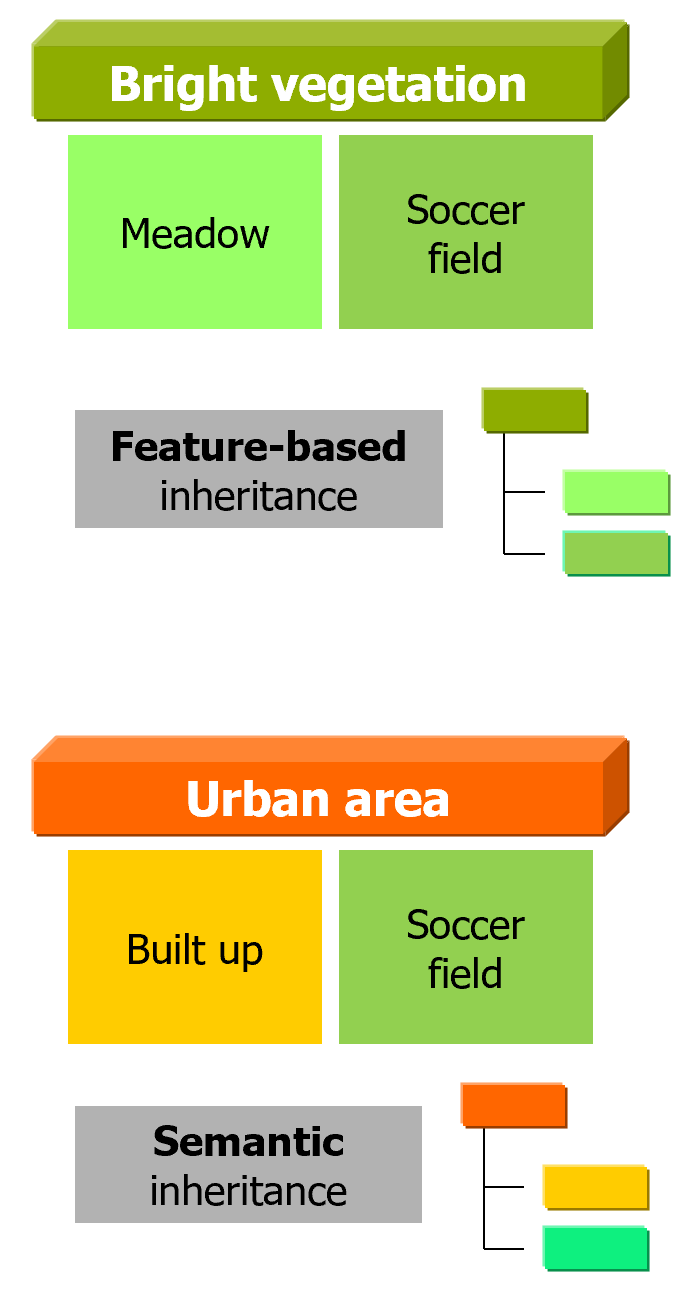
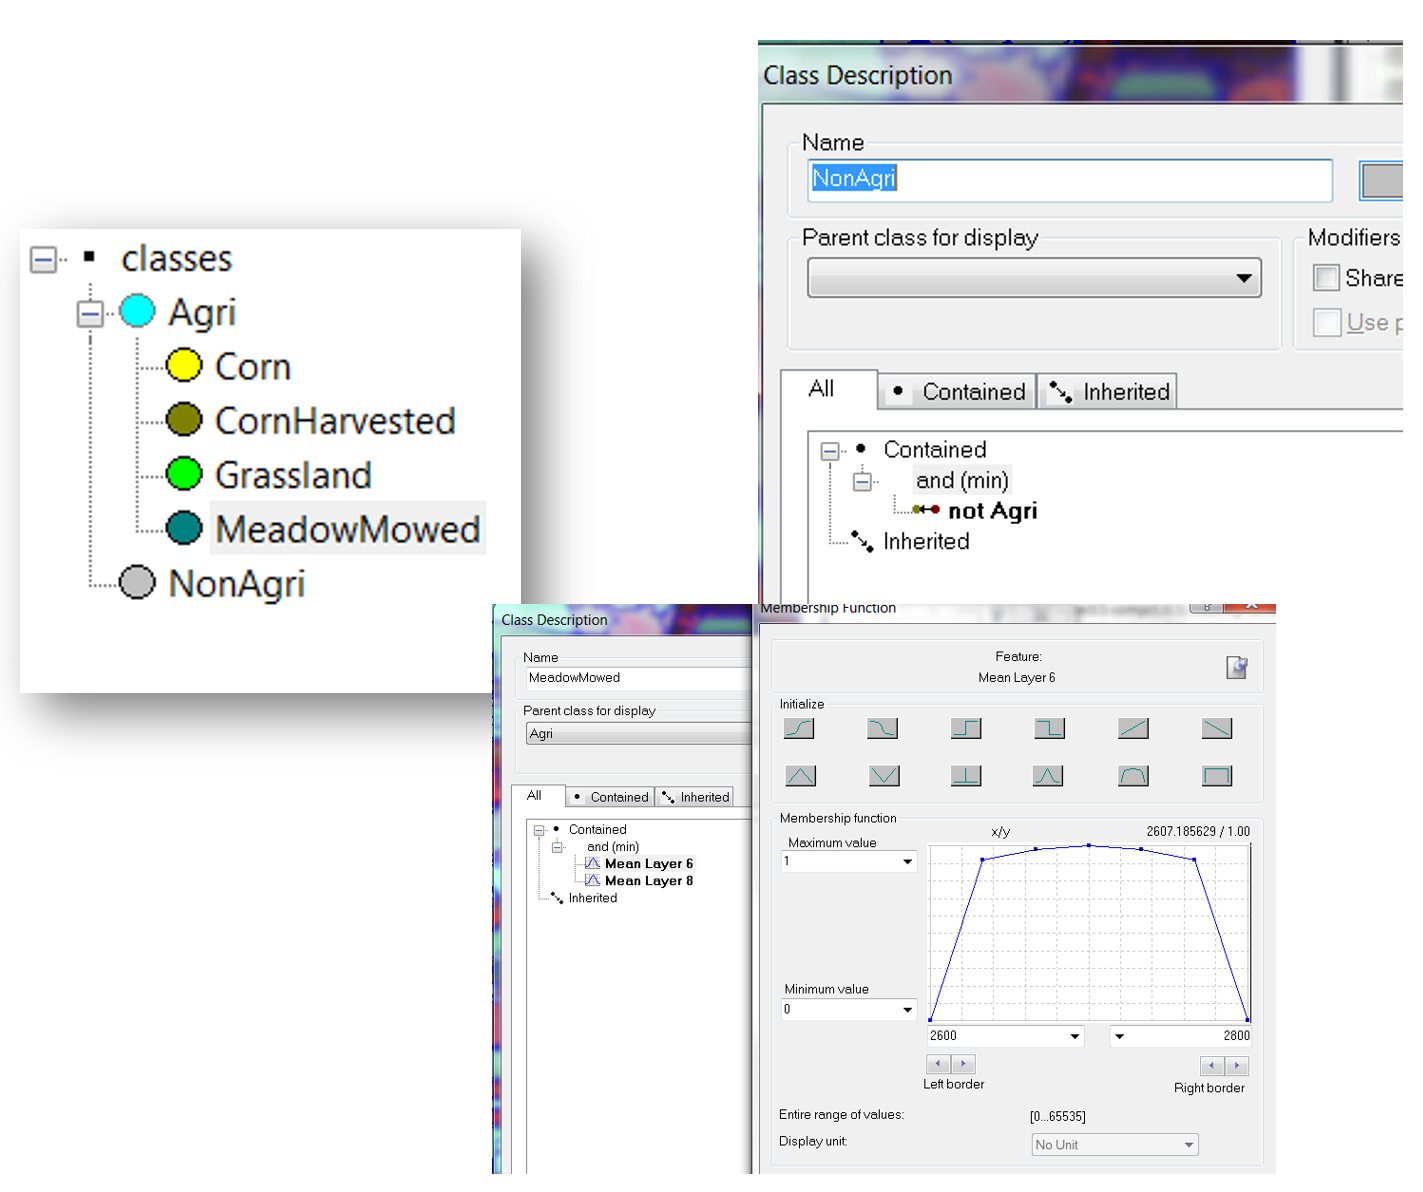
Class hierarchy (in eCognition)
Classes are embedded in a hierarchical heritage scheme
(1) Feature-based inheritance
- child classes inherit all descriptive features from their parent classes
- Not confined to spectral values
(2) Semantic inheritance
- Classes can be grouped semantically
- Belong to the same logical parent class
- Semantic inheritance may turn into feature-based when additional explicit information is provided
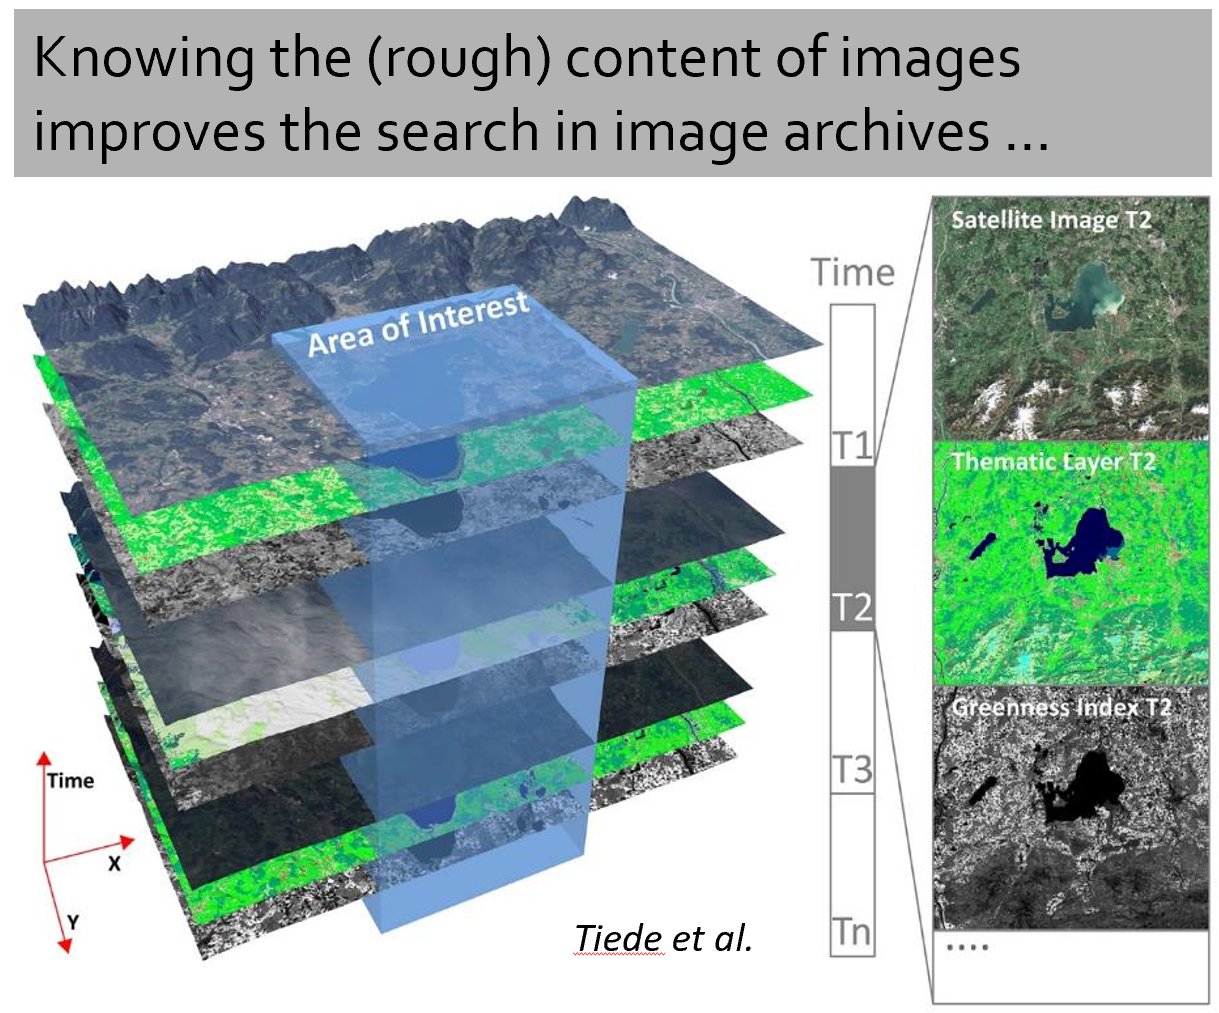
What is semantic querying?
Example: Monitoring of water quality in swimming lakes over three seasons
Image search criteria: [(0) sensor type], (1) time window , (2) geographical focus (AOI),
(3) cloud cover , (4) thematic focus , (5) monitoring period.
- Use standard metadata (location) and cloud mask
- Thematic focus: requires a fundamental (i.e. low level semantic) concept of the existence and representation of (swimming) lakes.
- Temporal aspect: (constancy or change) implies the notion for changes in critical indicators, e.g. by indices in IR reflectance recorded by multi-temporal imagery
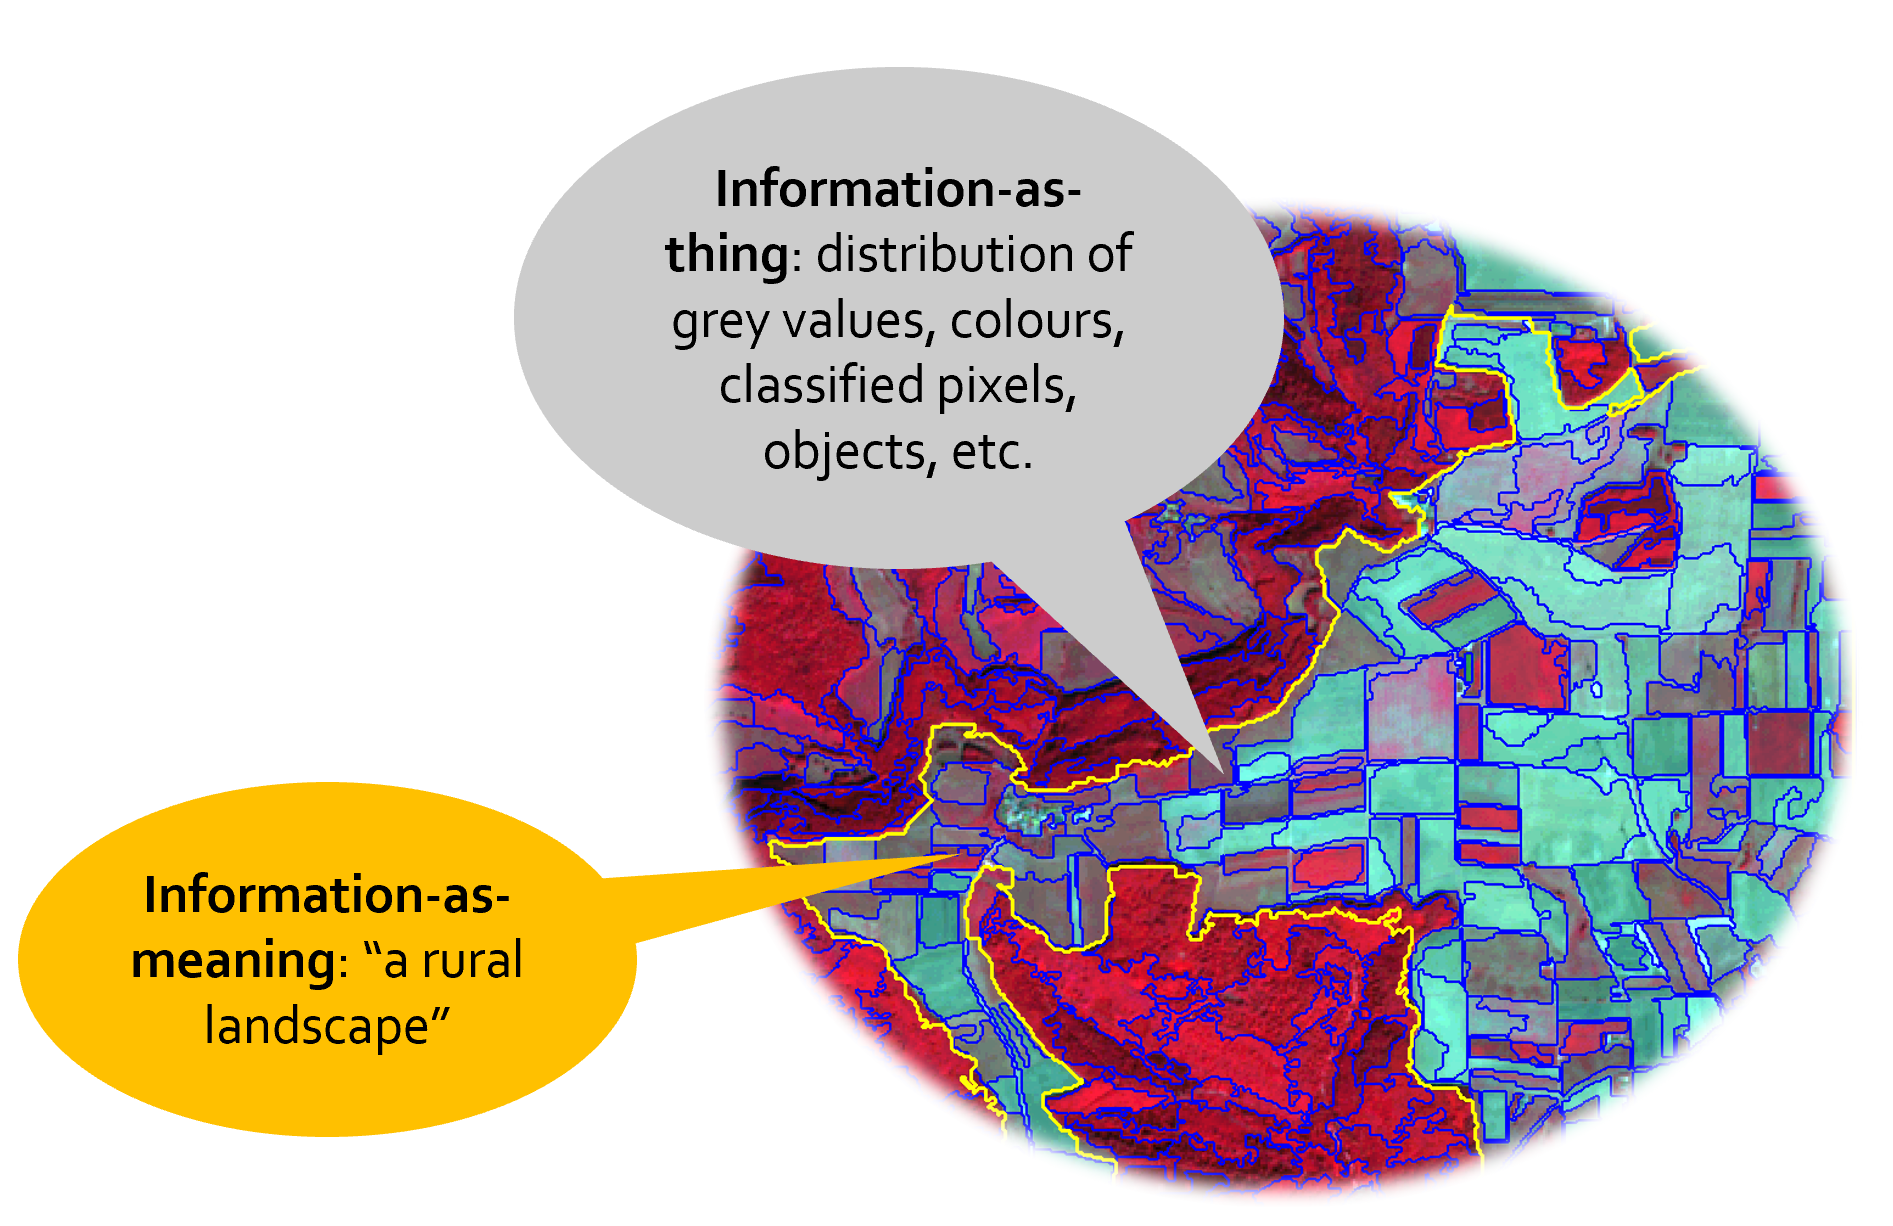
Data to information
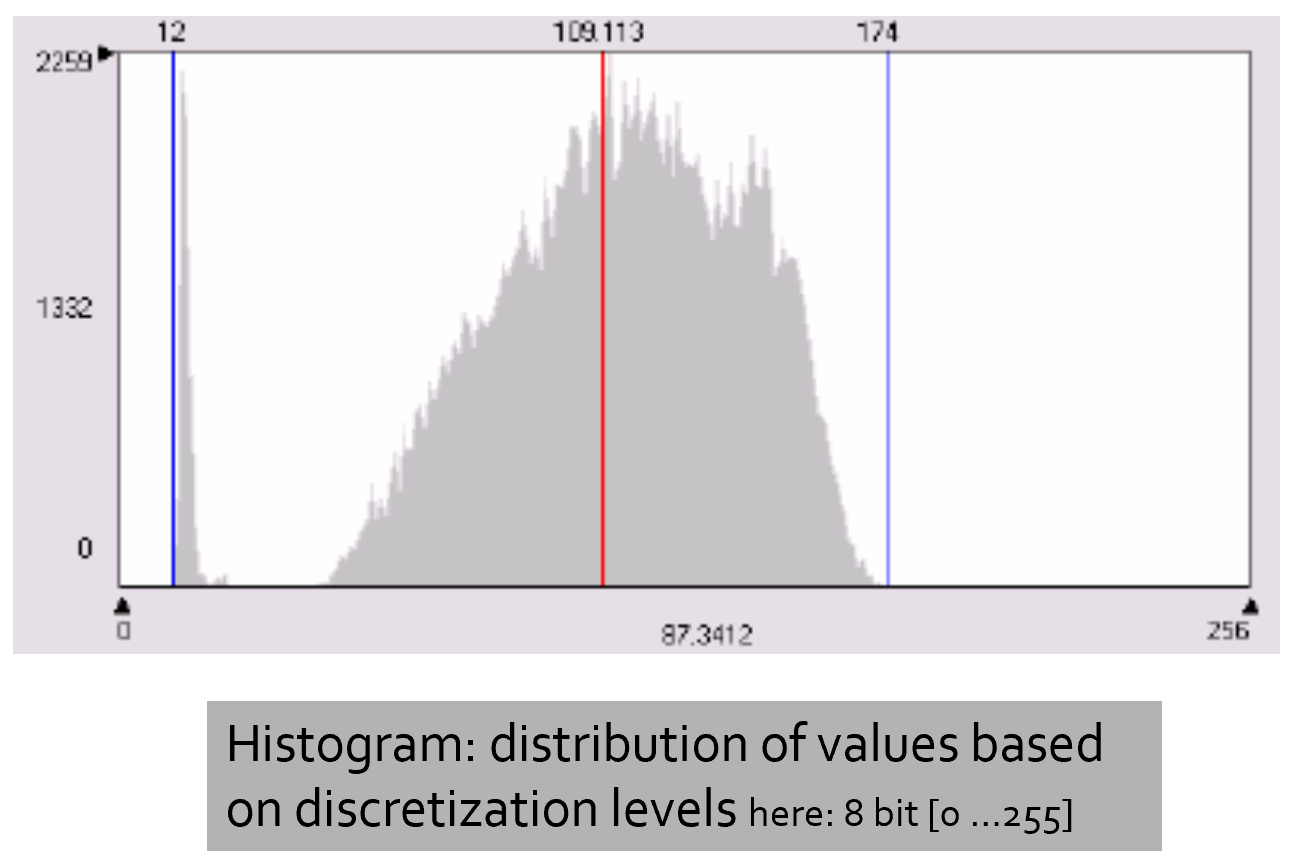
How to measure the information in an image?
- Histogram (distribution of values)
- Distribution of colours / colour levels
- Image content (based on classification)
Data to information (cont.)
Information measurement requires information units
(bins, classified pixels, objects, etc.)
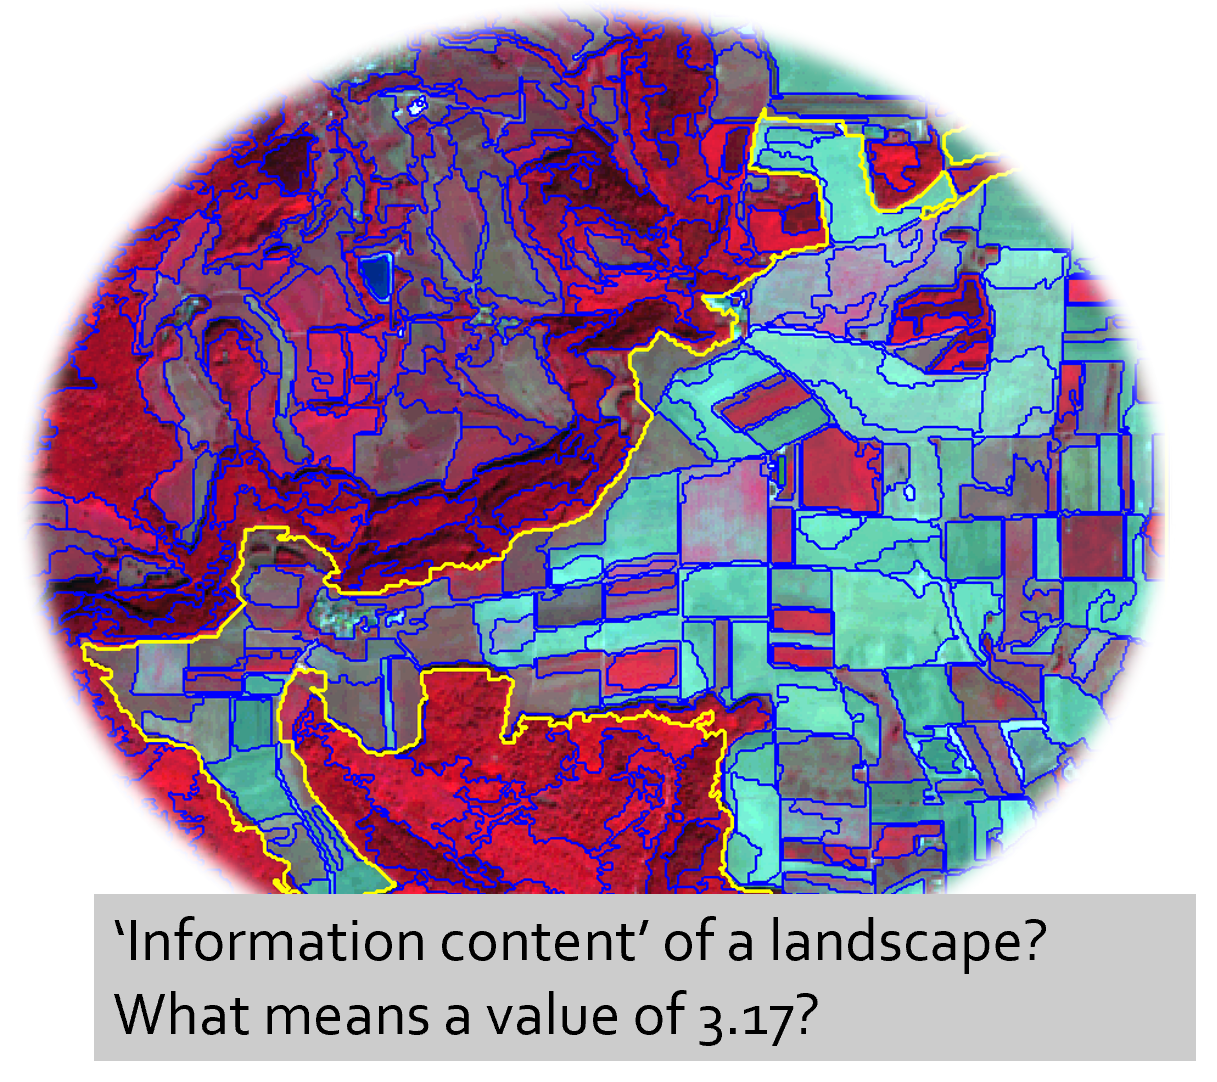
Quantifiable information content
- Image content can be measured based on classification
- Indices: Diversity H, Dominance, Evenness
- Key elements: categorised units, number and percentages of classes

where P = percentage, i = class 1 … i
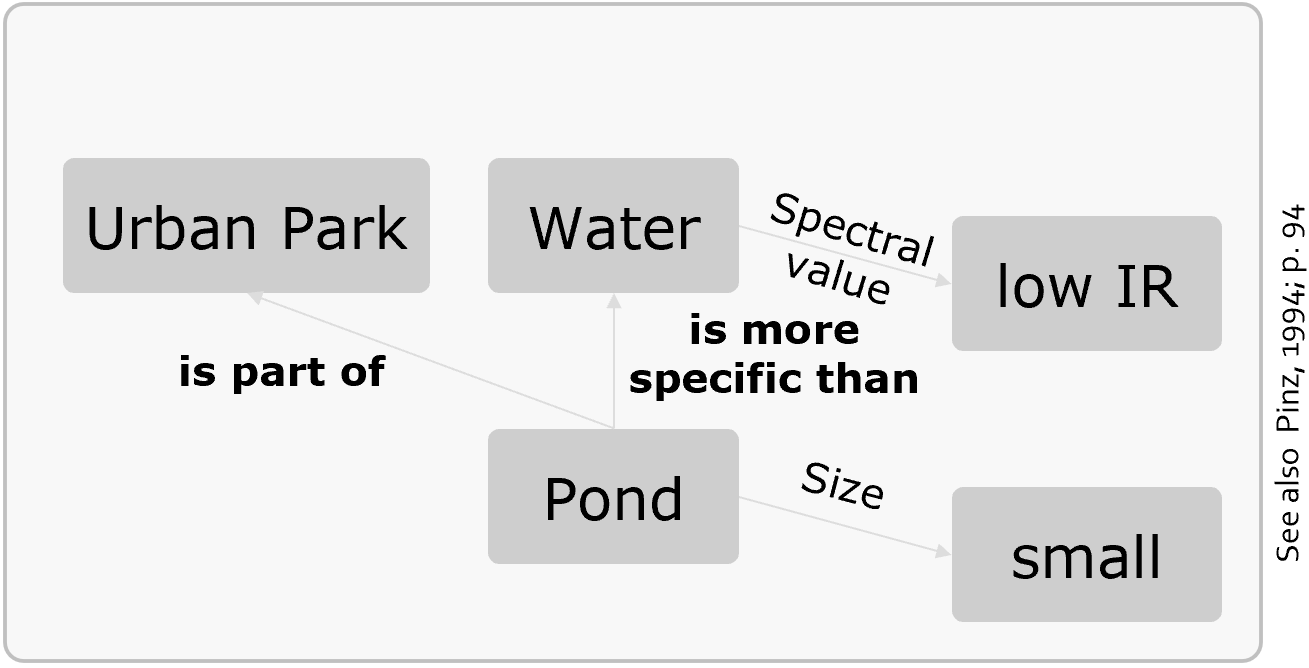
Knowledge organising systems (KOS)
Structural knowledge can be organized in knowledge organizing systems (KOS)
- Realised as graphic notations such as semantic nets or frames
- Semantic knowledge representation
- using inheritance concept, e.g. ‘is part of’, ‘is more specific than’, ‘is an instance of’
Semantic net
- Control over existing connections, once established
- Transparency and operability
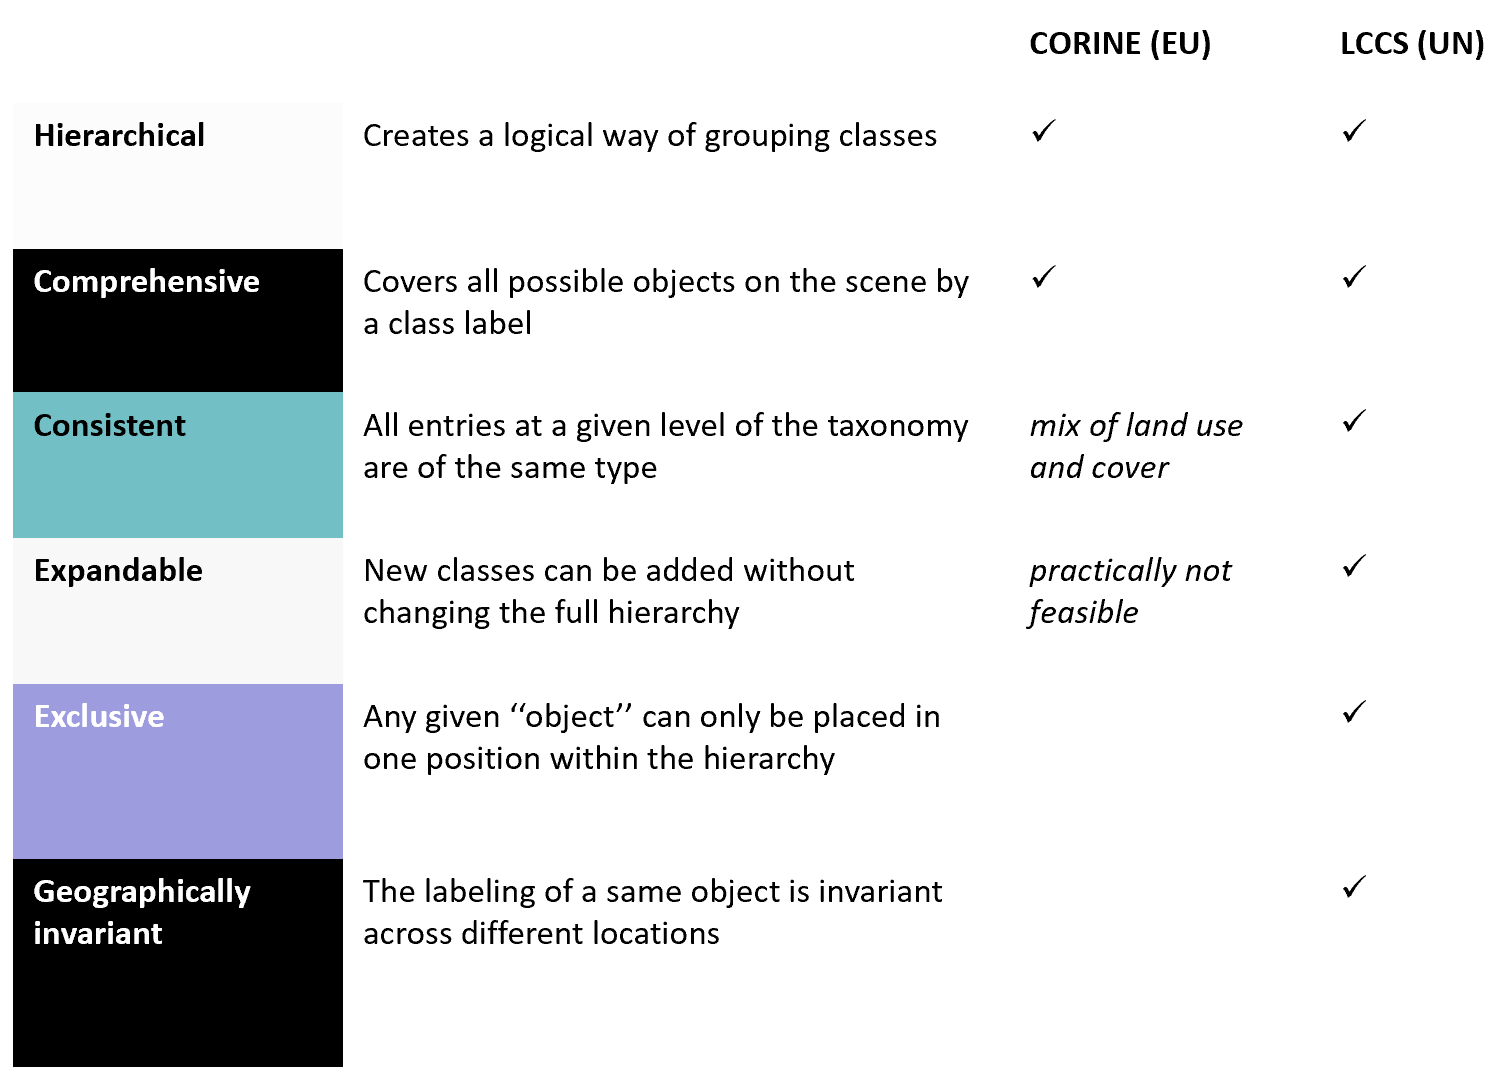
Classification schemes
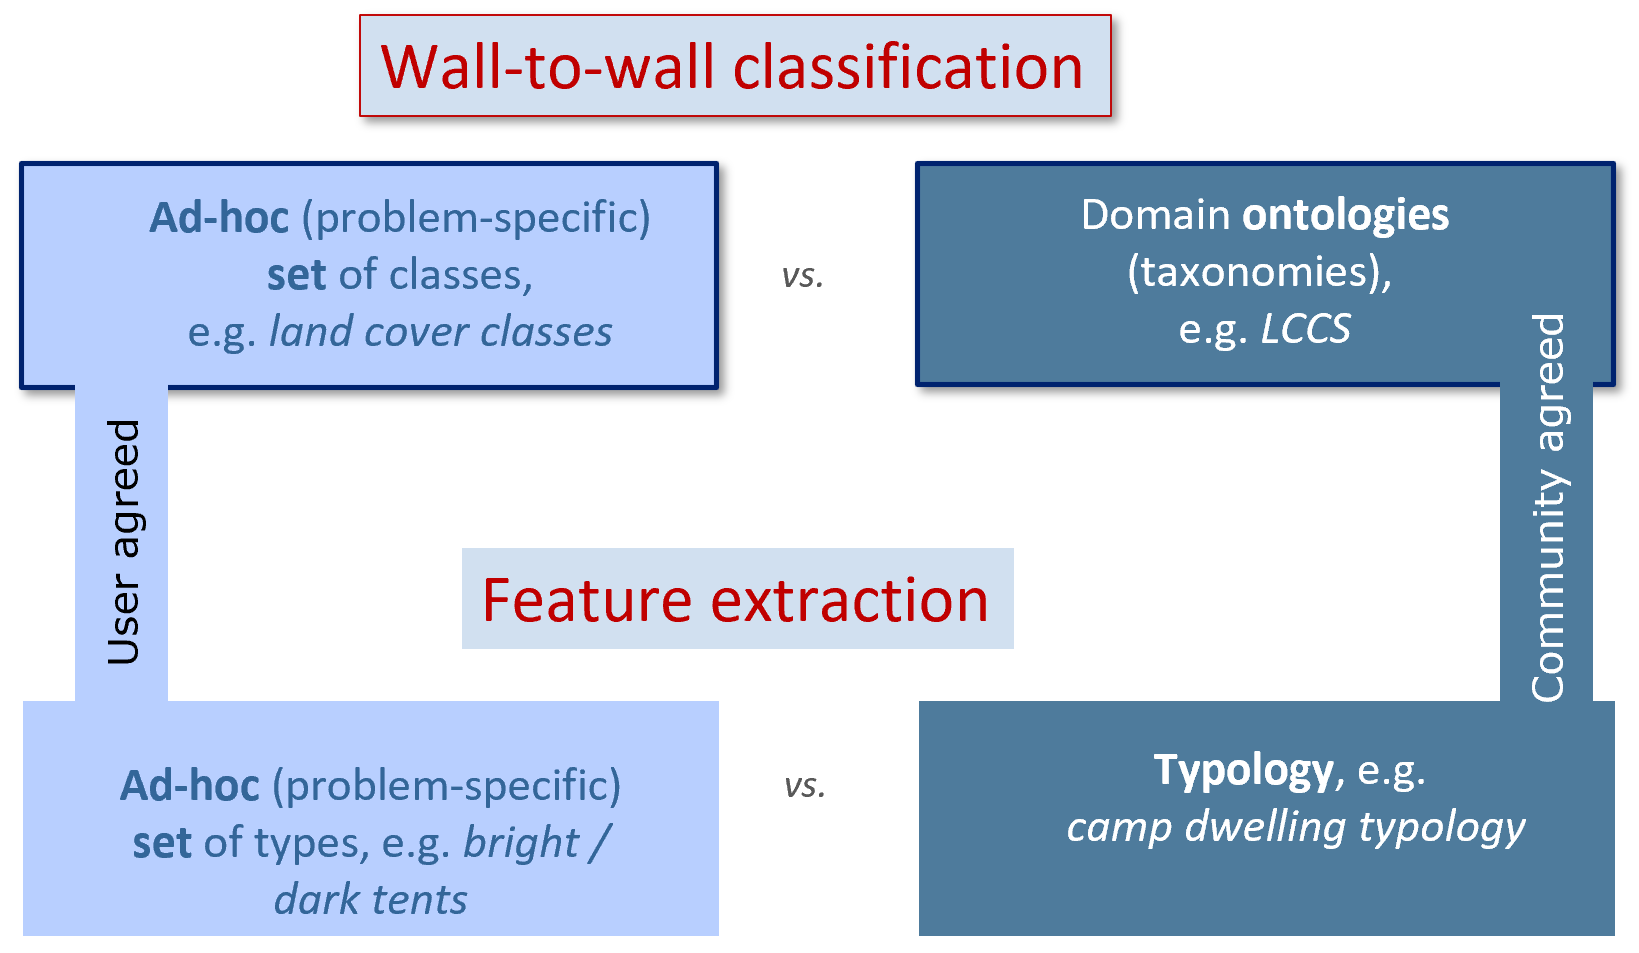
Classification schemes / taxonomies
Corine Land Cover (CLC)
- Standard EU mapping scheme (used by European Environmental Agency EEA) initiated in 1985 (reference year 1990)
- Updates produced in 2000, 2006, 2012, 2018 with the latest update (CLC+) under production - integrating the first time OBIA relevant segmentation techniques
- CLC+ technical document: https://land.copernicus.eu/user-corner/technical-library/clc-core-consultations-for-the-technical-specifications
Classification schemes
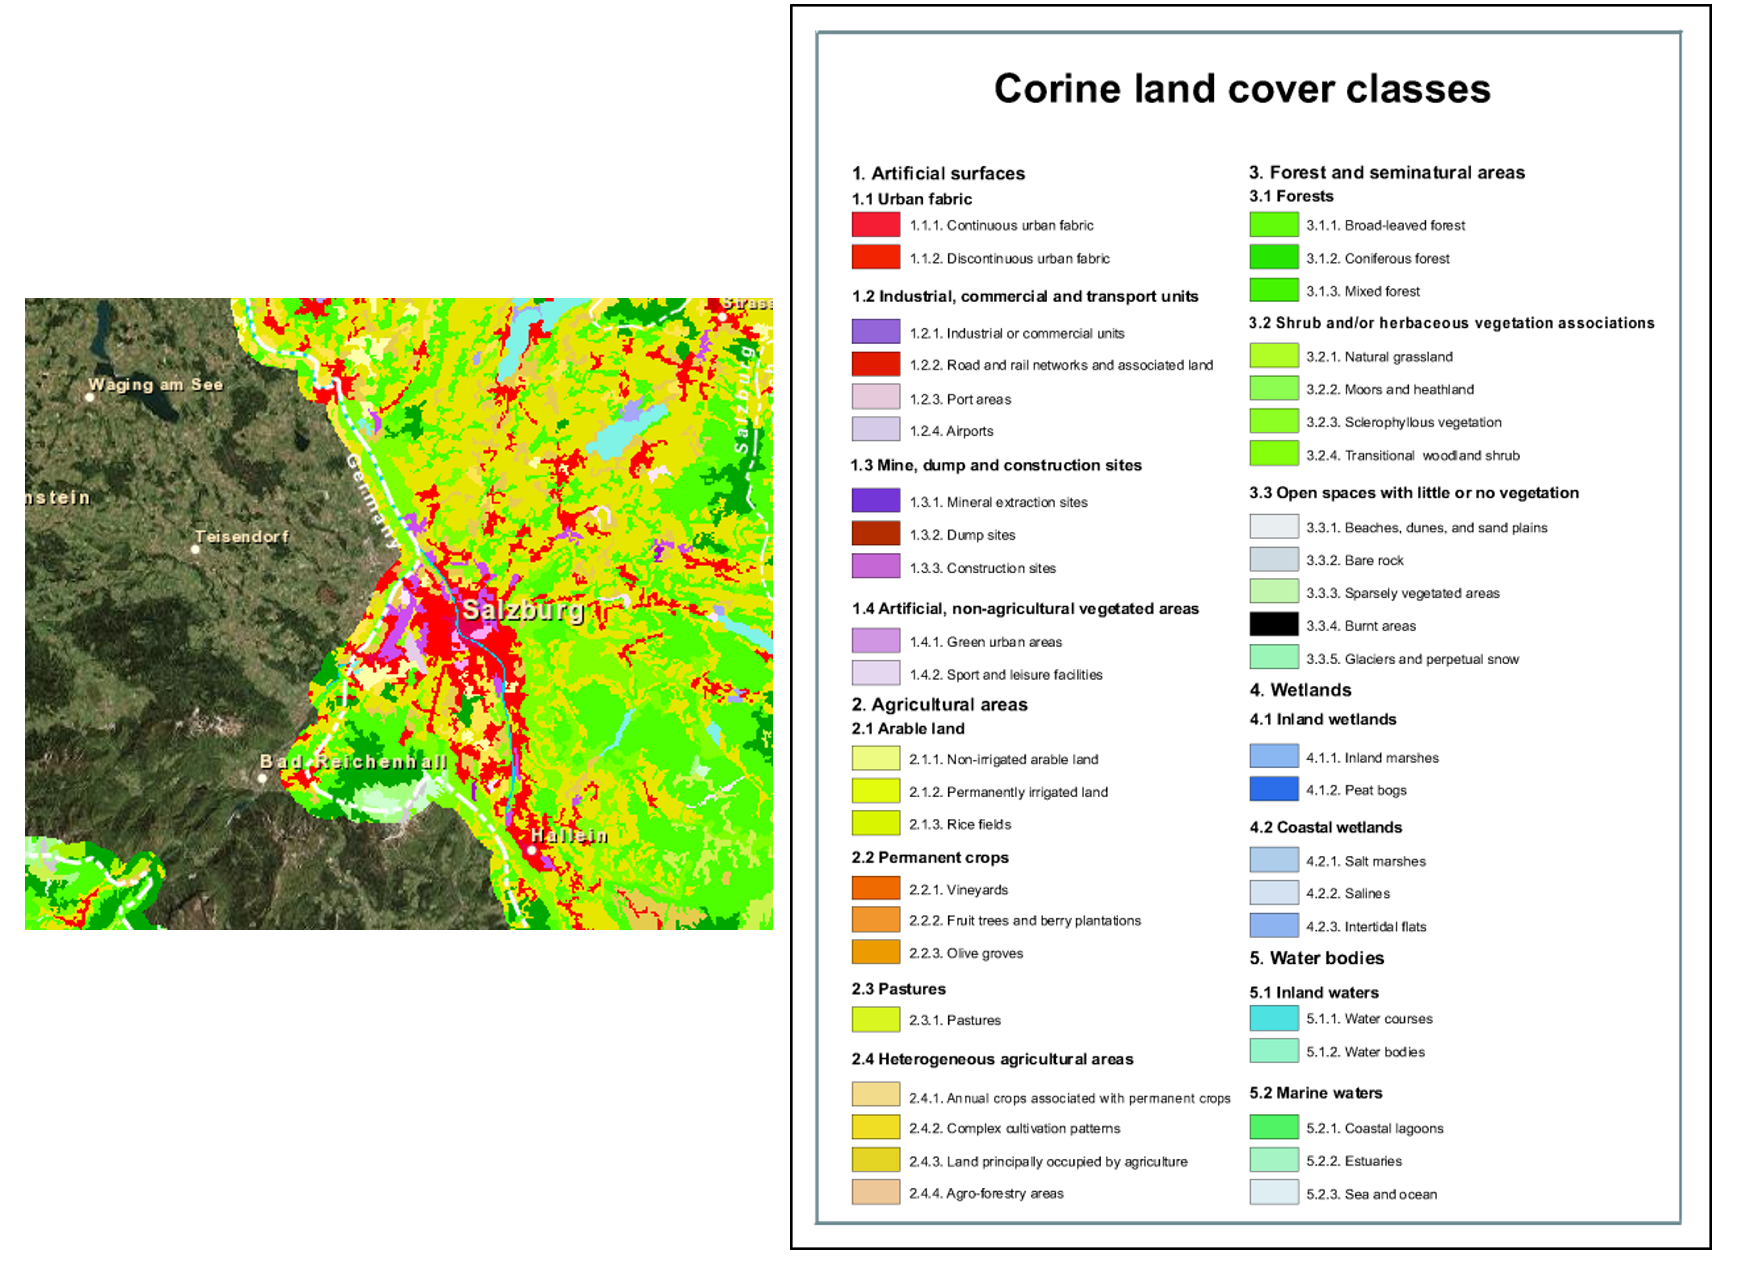
CLC consists of an inventory of 44 classes. It uses a Minimum Mapping Unit (MMU) of 25 ha for areal phenomena and a minimum width of 100 m for linear phenomena
Classification schemes
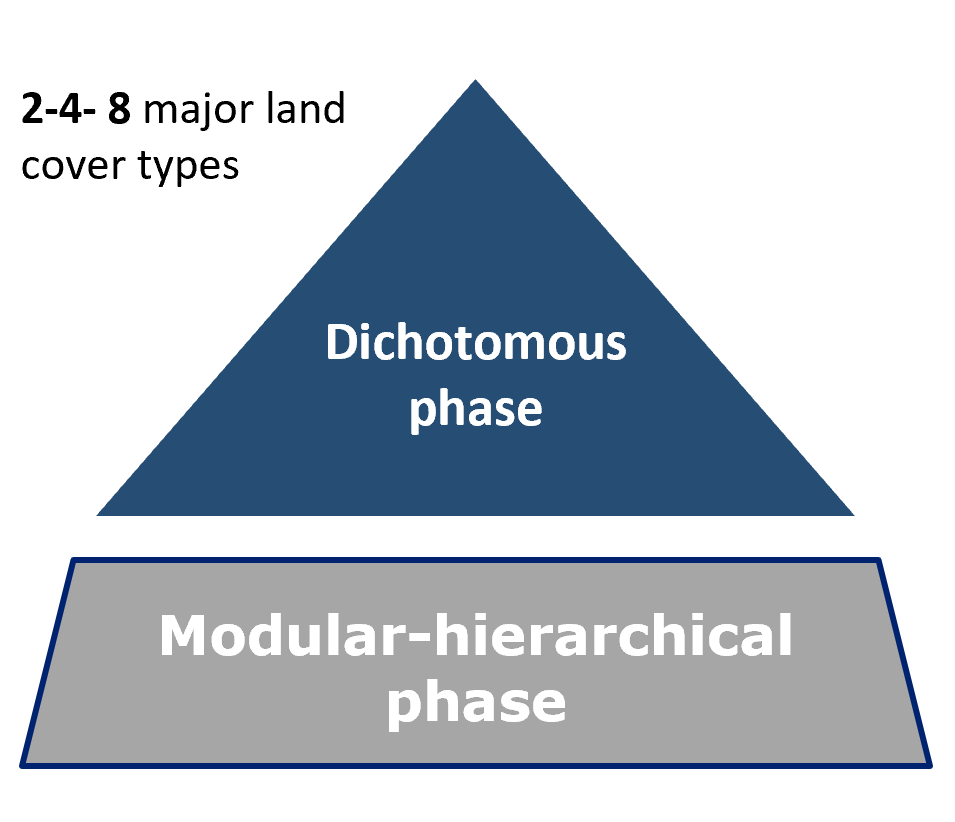
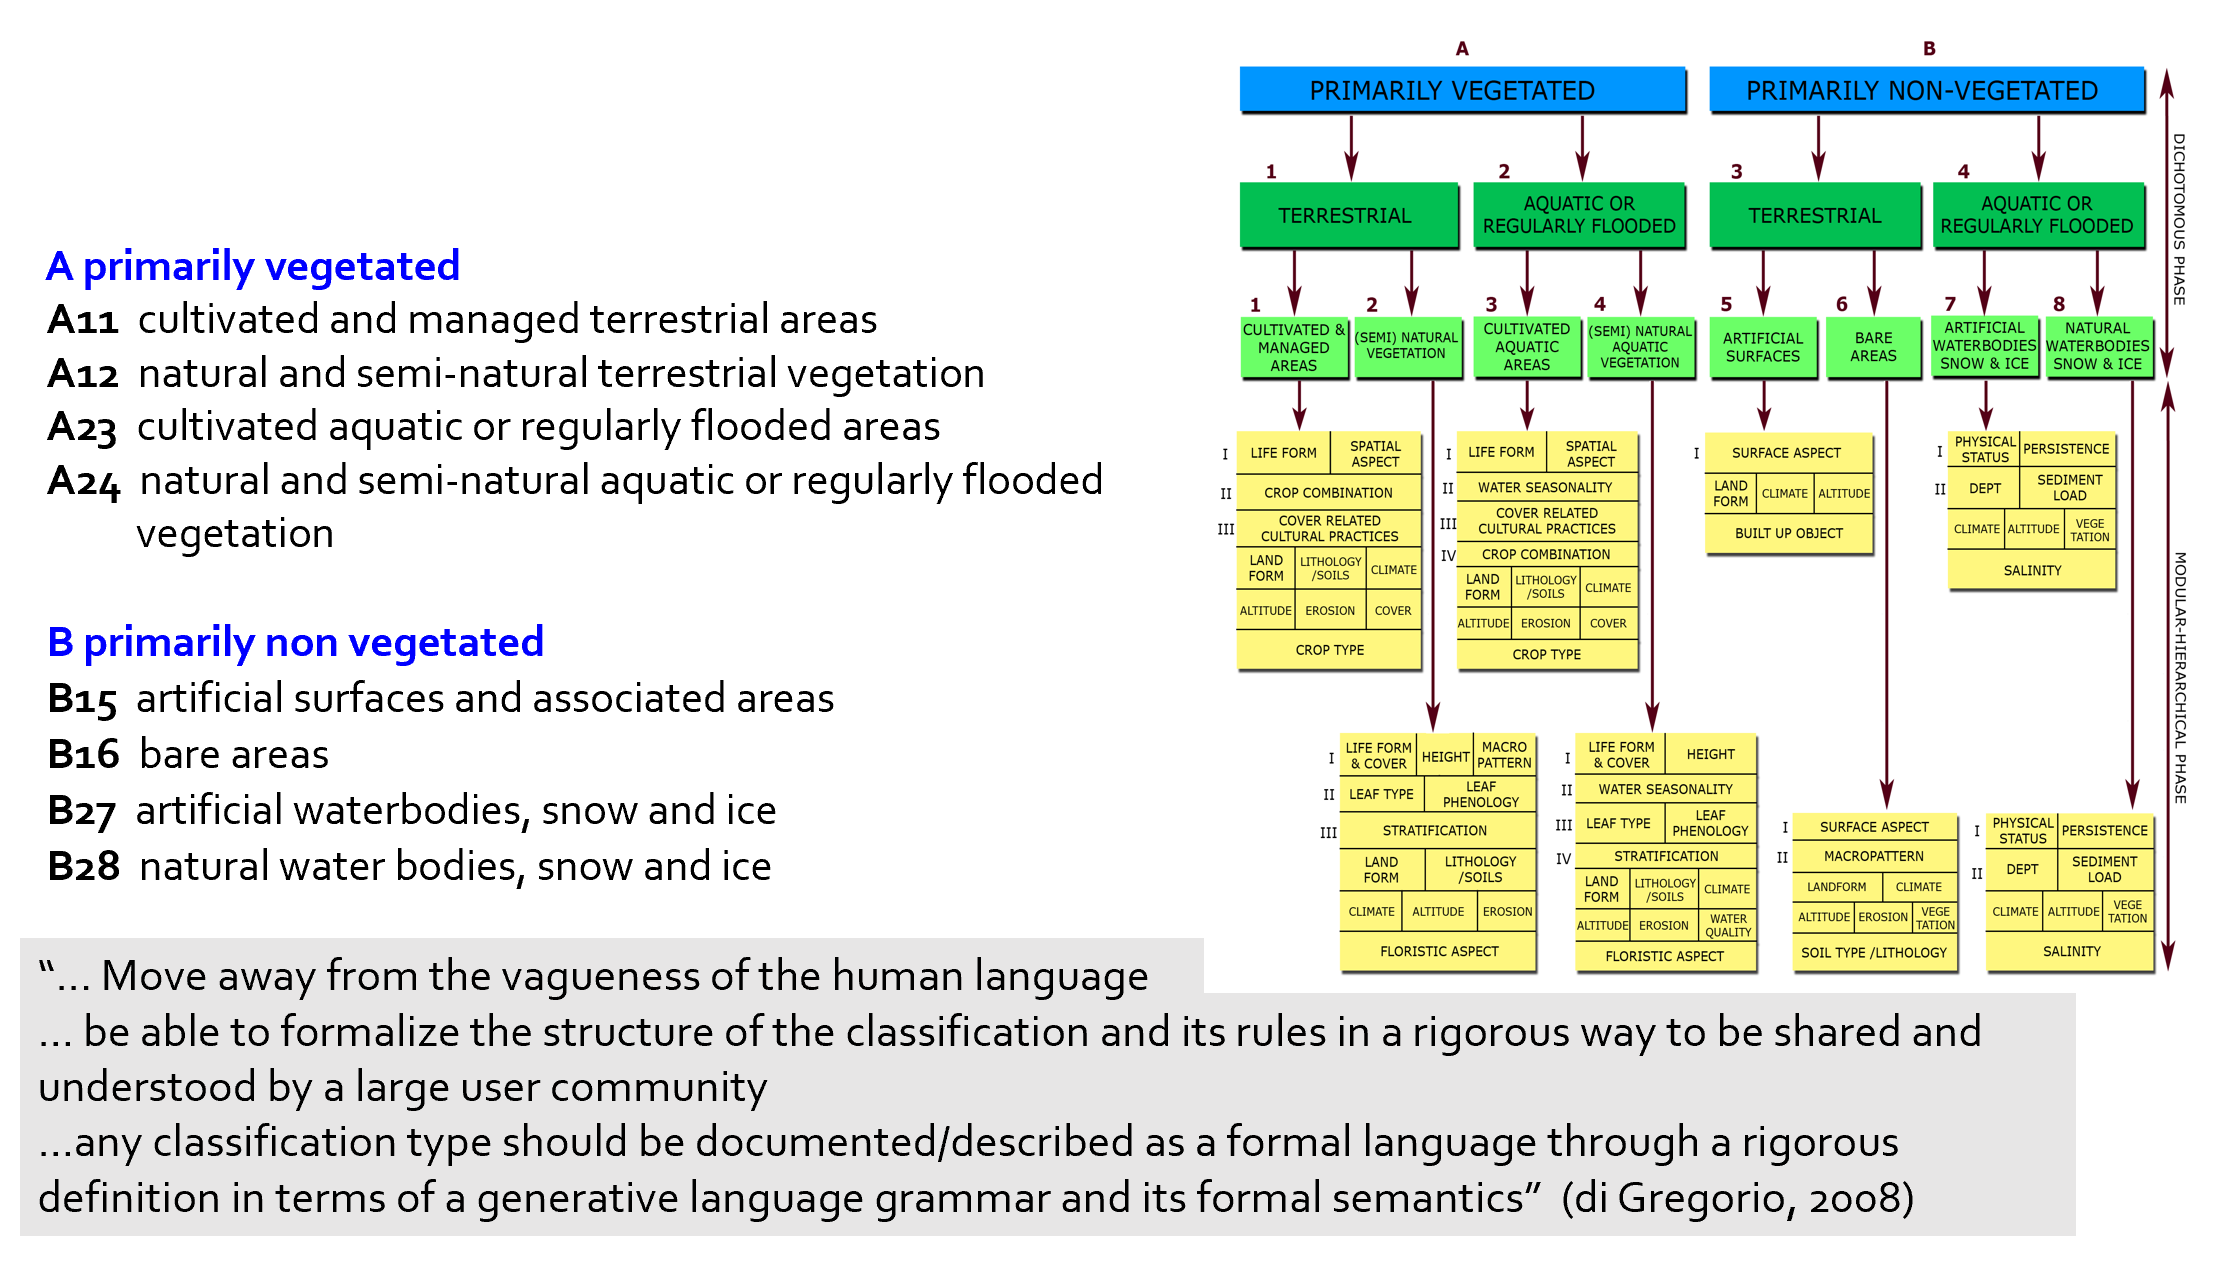
Land Cover Classification System (FAO-LCCS)
- capable to record any land cover type, independent of specific applications and/or geographical areas
- overcome problems associated with the interpretation of different land cover class definitions (Mucher et al. 2014)
- uses a set of independent diagnostic criteria strictly based on vegetation physiognomy and structure rather than establishing land cover classes based on terminology (Kosmidou et al. 2014)
- comprehensive land cover characterization, regardless of mapping scale, data collection method or geographic location.
Classification schemes
Spectral libraries
Spectral libraries represent spectral reflectance and physical properties of different land cover types
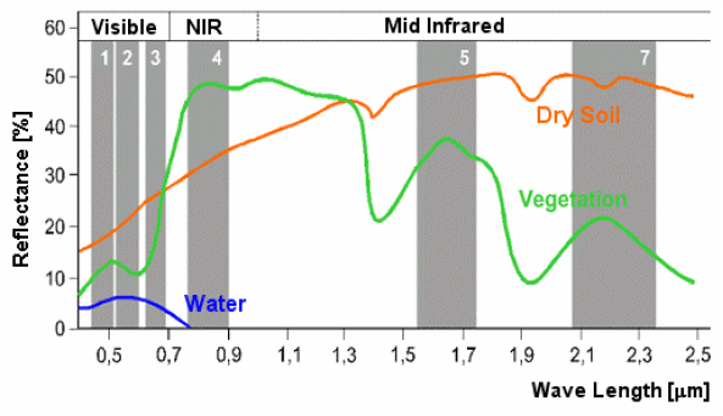 simplified model!
[5] Class modelling
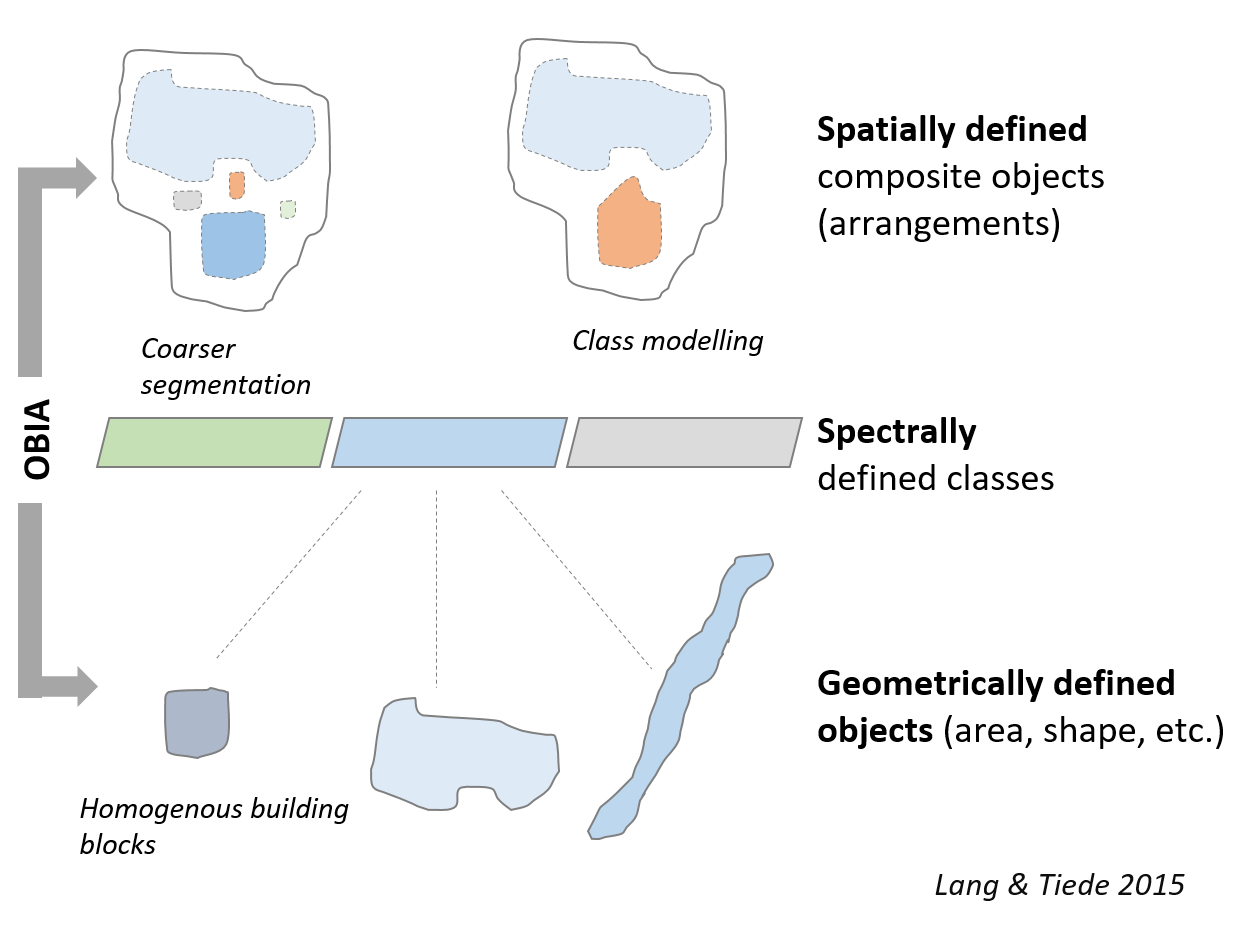
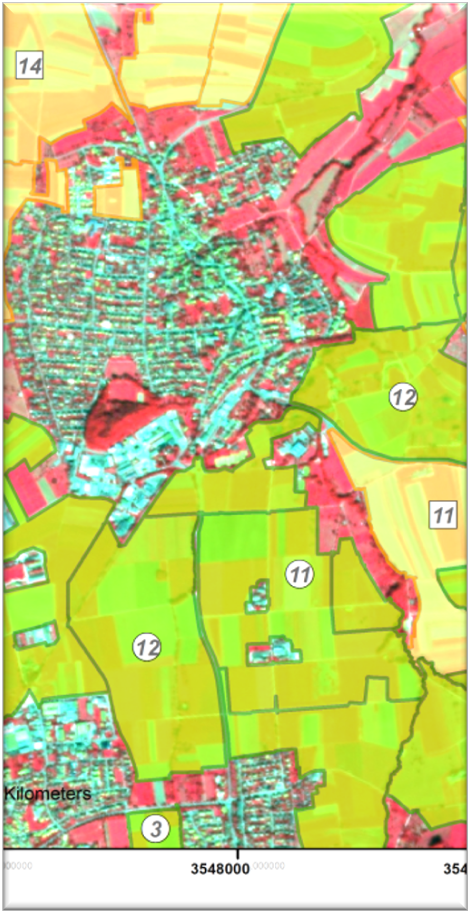
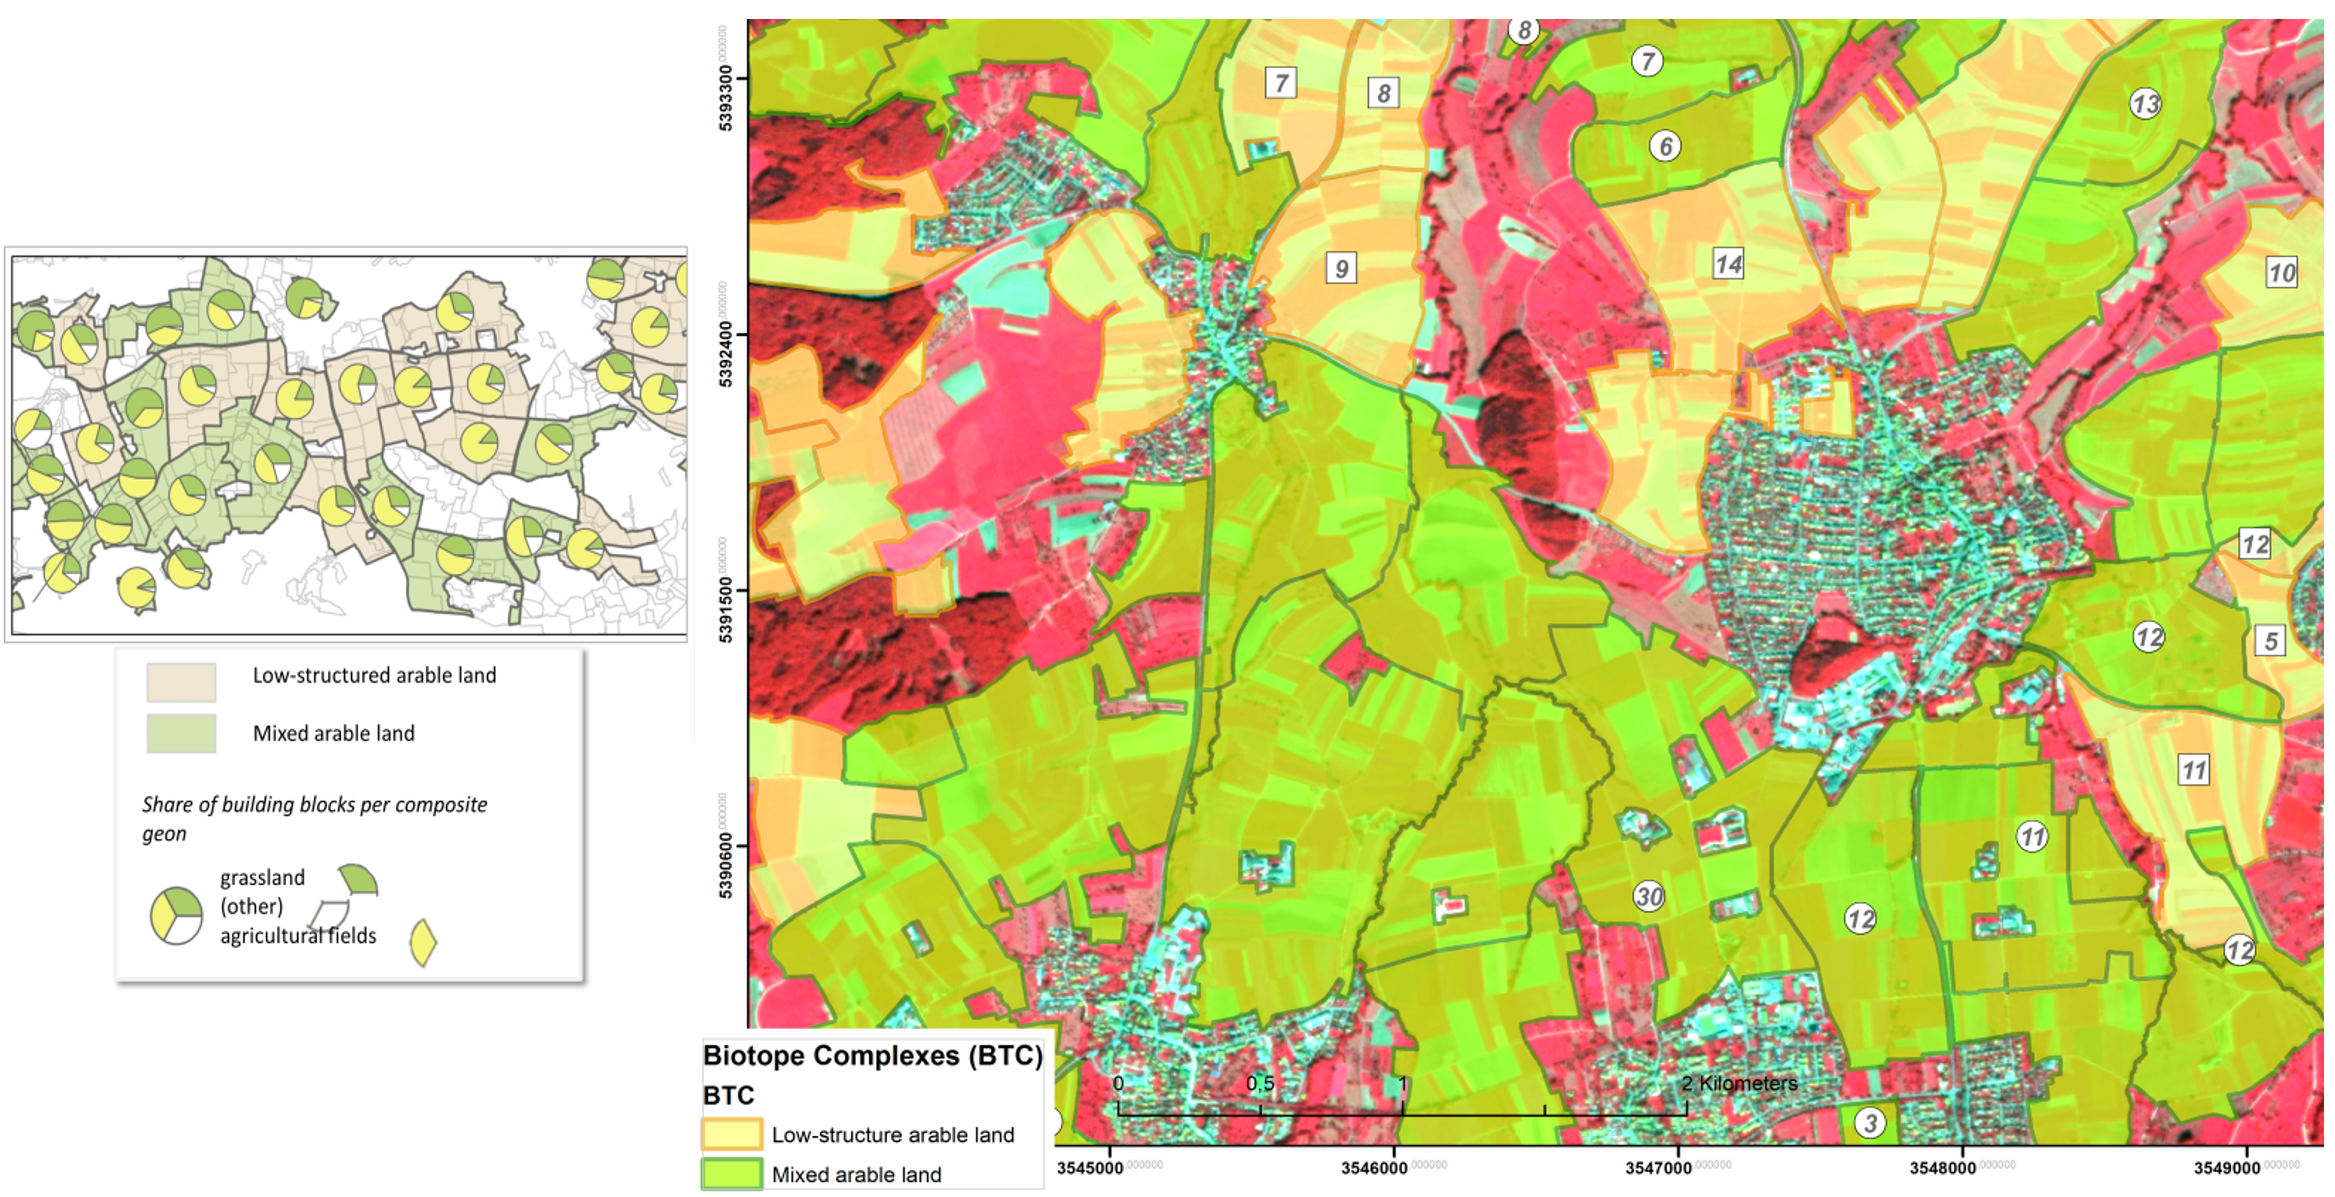
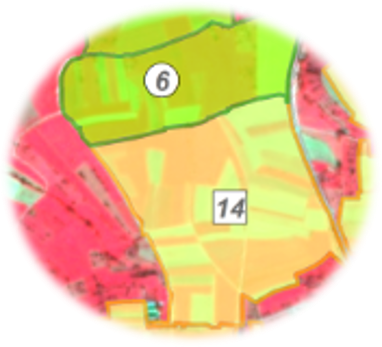
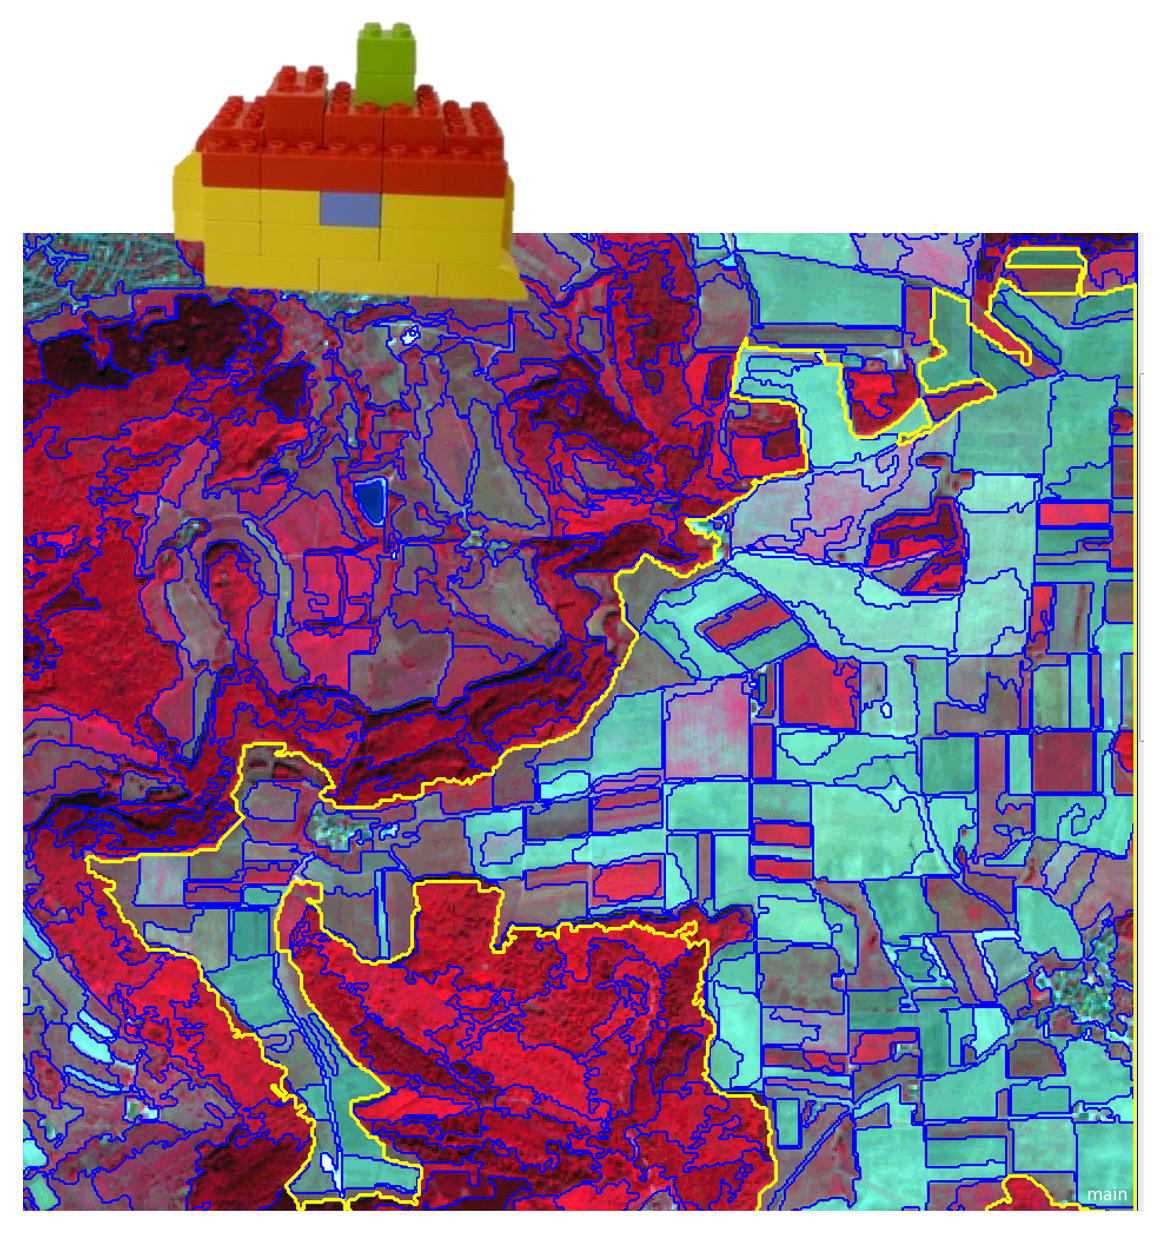
Composite objects
Composite objects
Level of landscape elements
- Spectrally homogenous, correspond to agricultural fields, road segments, blocks of houses etc.
- Contain elements (building blocks)
- Are spectrally heterogeneous, but functionally homogenous
- Geons (Lang et al. 2014)
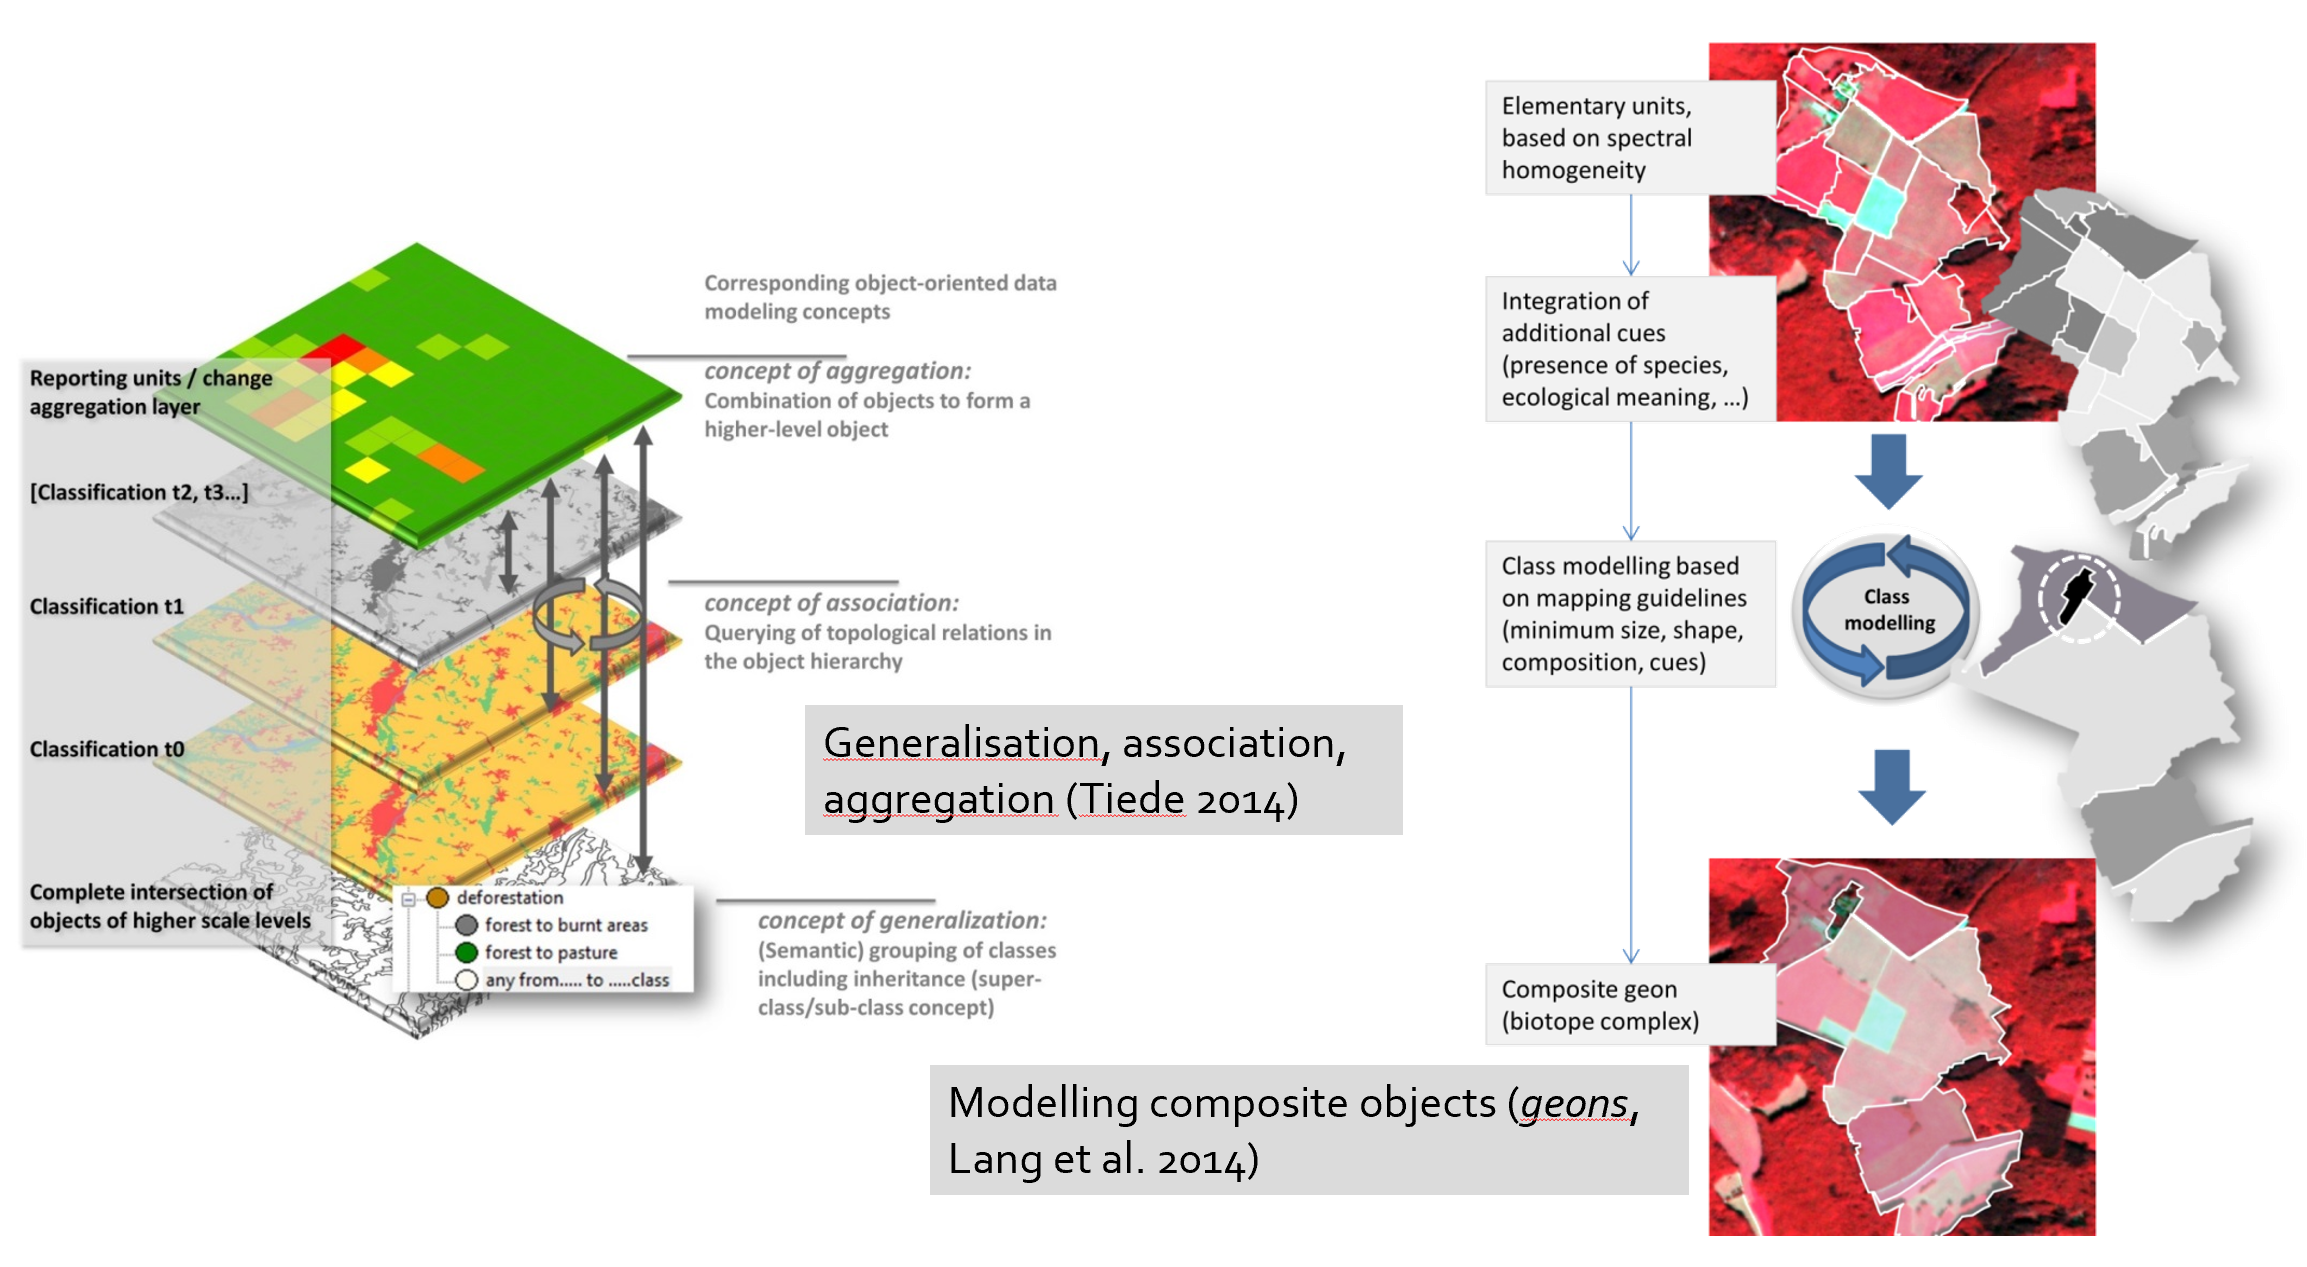
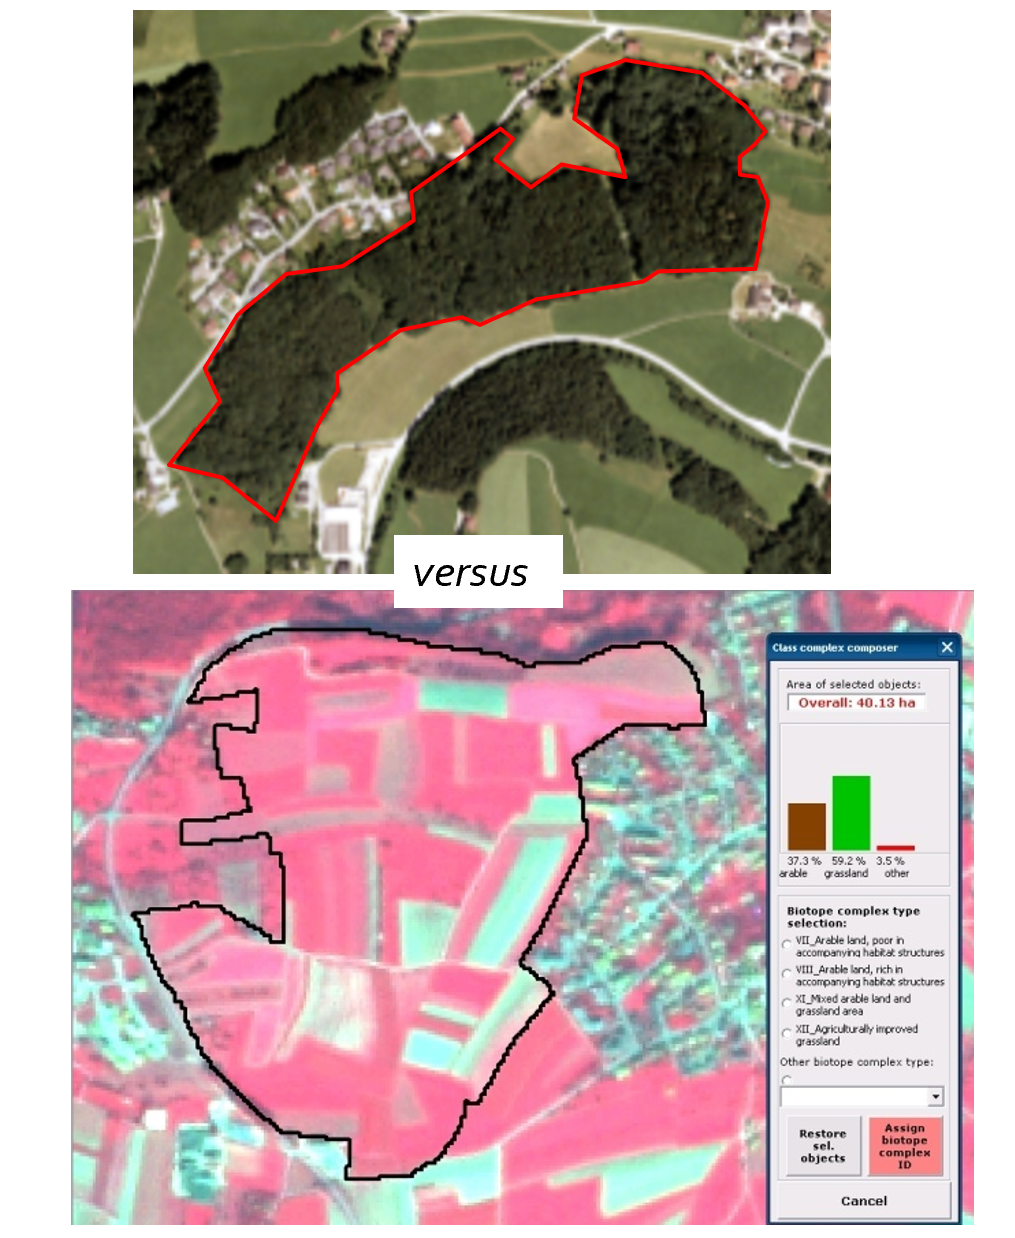
Class modelling
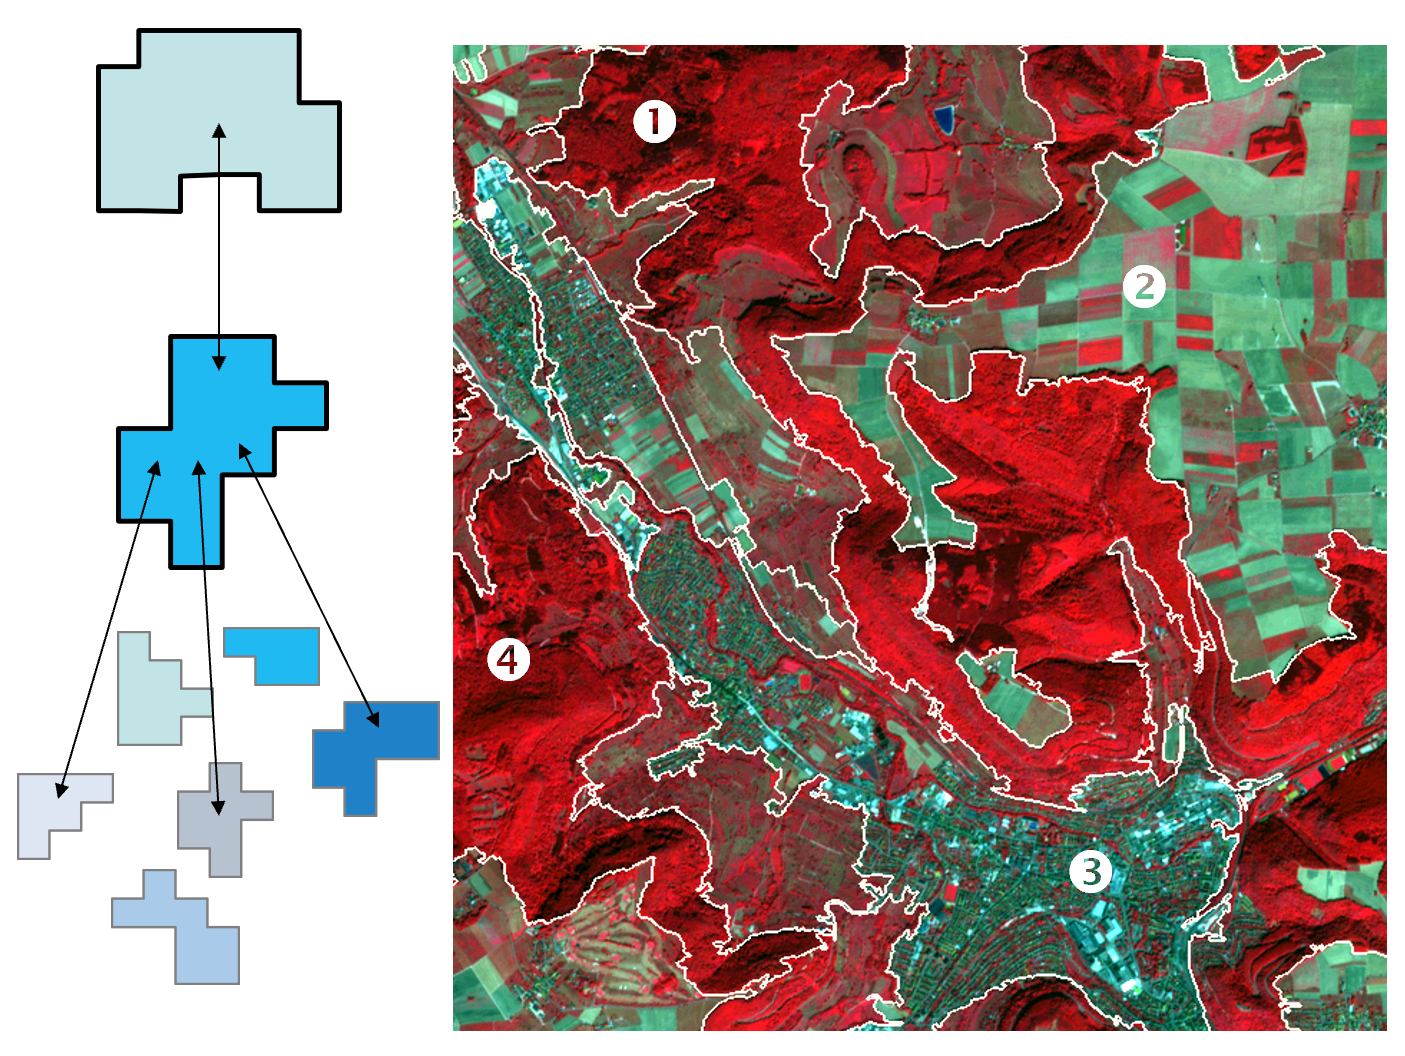
Ambition: to delineate and classify composite objects in a complex real-world scene
- To represent the scene in at least in two hierarchical levels
- To delineate homogenous elementary units on lower level(s)
- To establish lateral and vertical relationships among objects (object-relationship modelling, ORM)
- To characterise the composition of target classes based on the arrangement of elementary units
Class modelling
Class modelling
A strategy to approach composite classes by applying multi-scale segmentation and spatial modelling
- The target classes represent functionally homogenous units – often spectrally heterogeneous –, as being composed by sub-units
- The delineation of target units may be ambiguous (but inter-subjectively agreeable – thus non-arbitrary)
- The spatial properties of composite classes (or objects) can be described and their structural arrangements of building blocks (elements) can be characterised
Class modelling
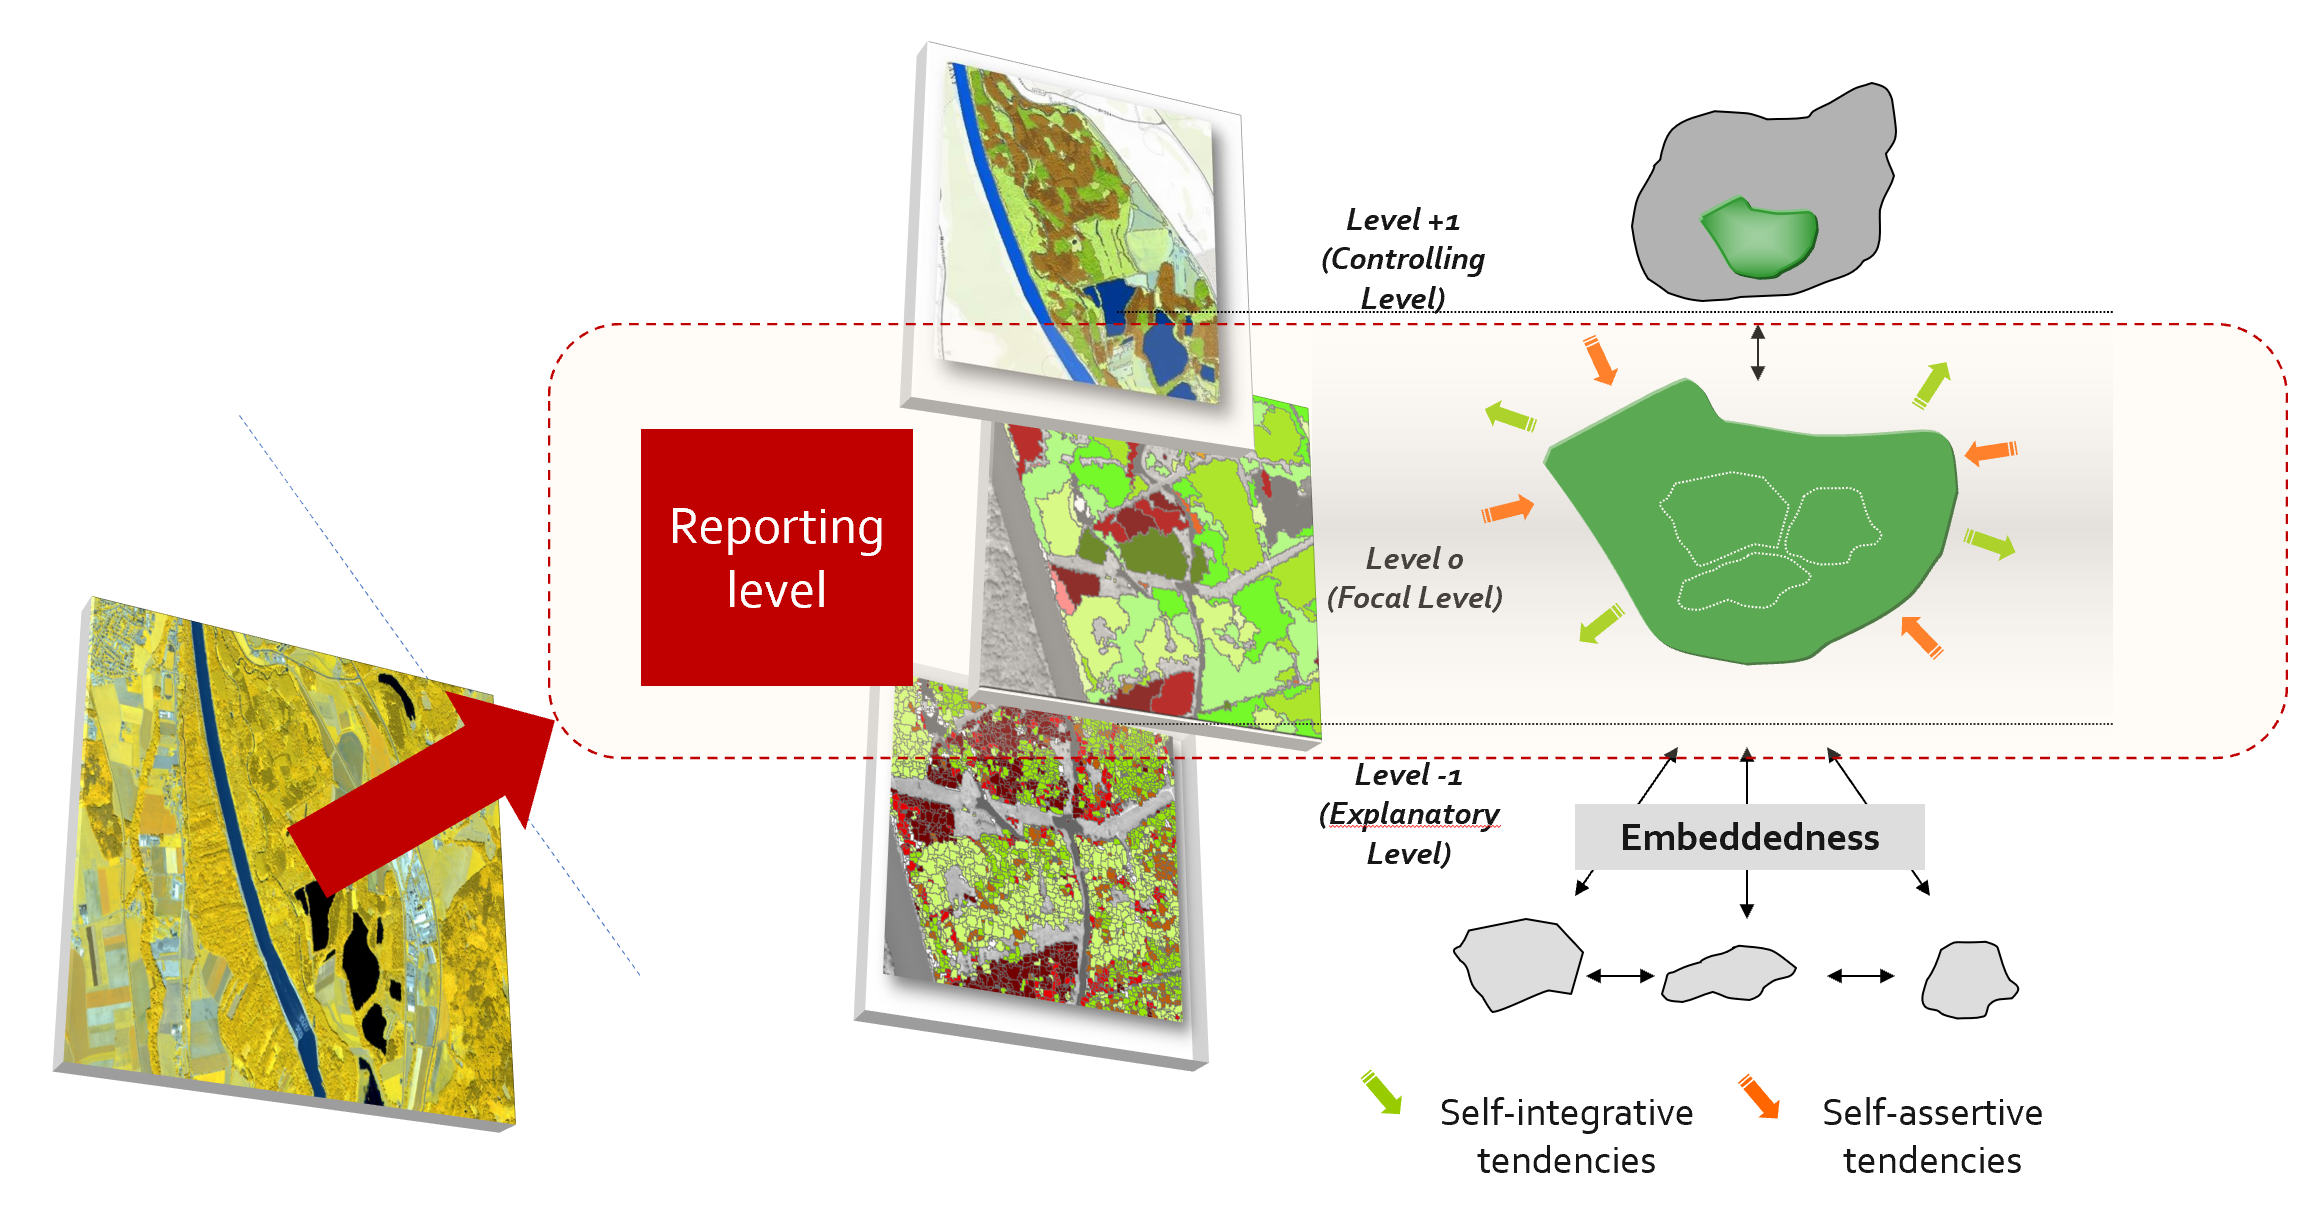
Multiscale class modelling
“Multiscale” is implicit in the term class modelling
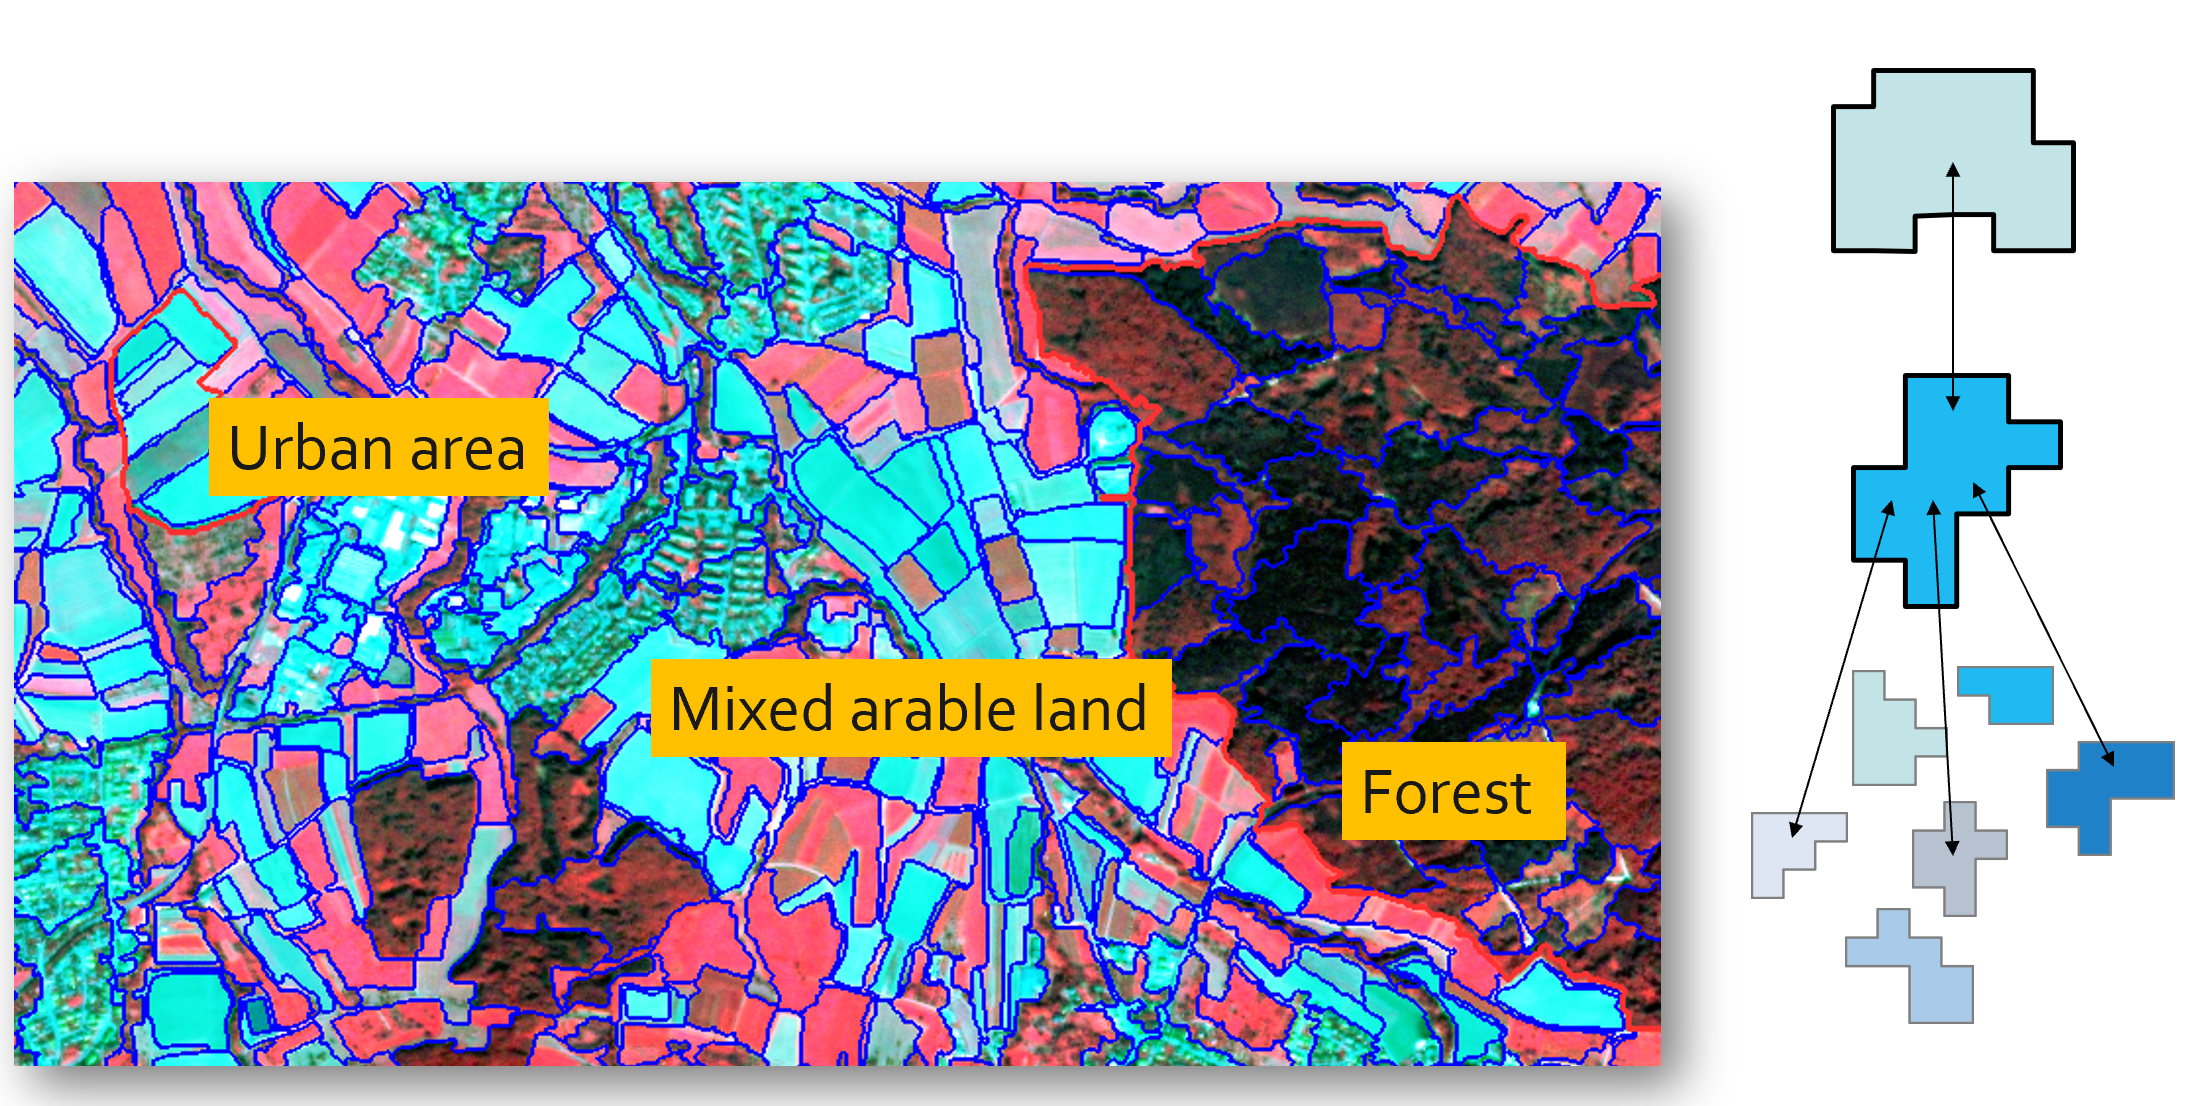
- A complex class (composite object) consists of several functional parts in a specific arrangement, such as:
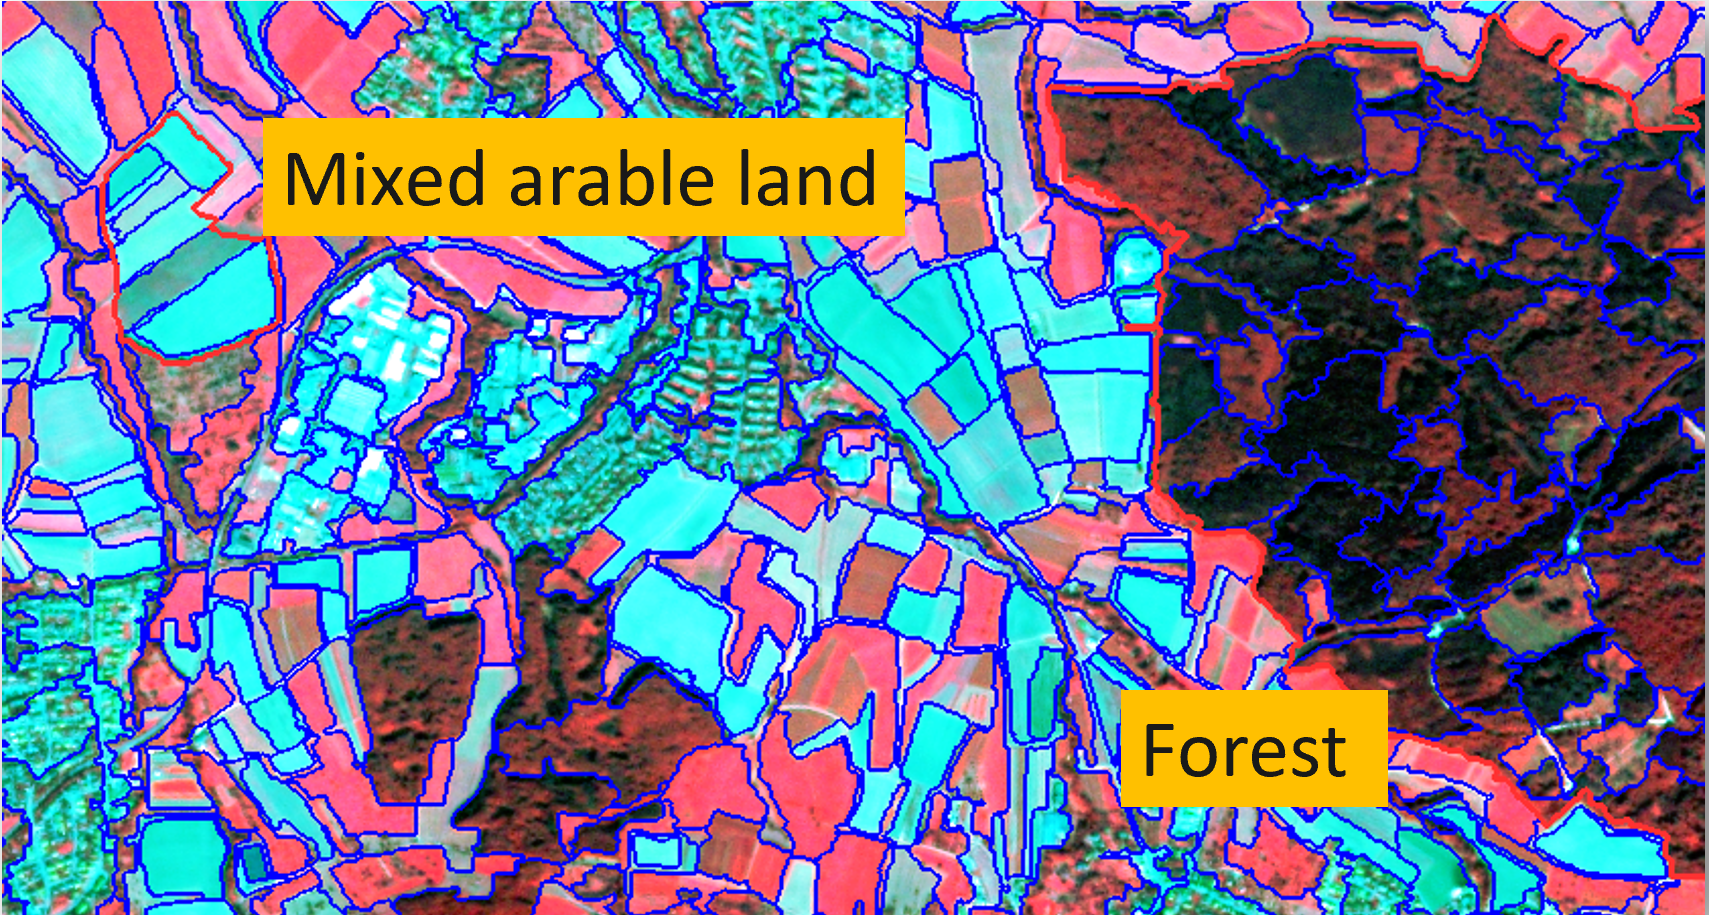
- ‘mixed arable land’ composed by a mix of agricultural and grassland fields
- ‘residential area’ composed by family houses, gardens, shopping malls, etc.
- Complex classes are hierarchically structured (‘body plan’)
Multiscale class modelling
Multiscale class modelling
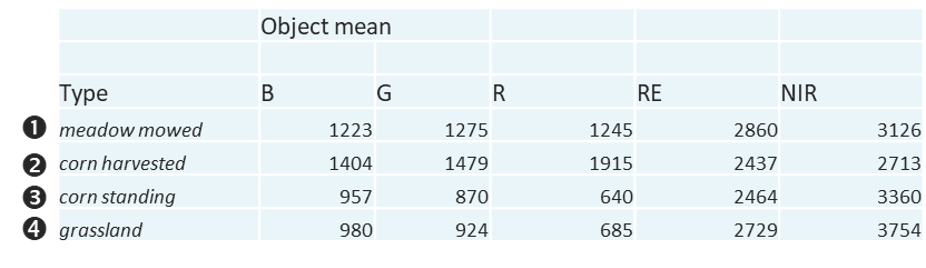
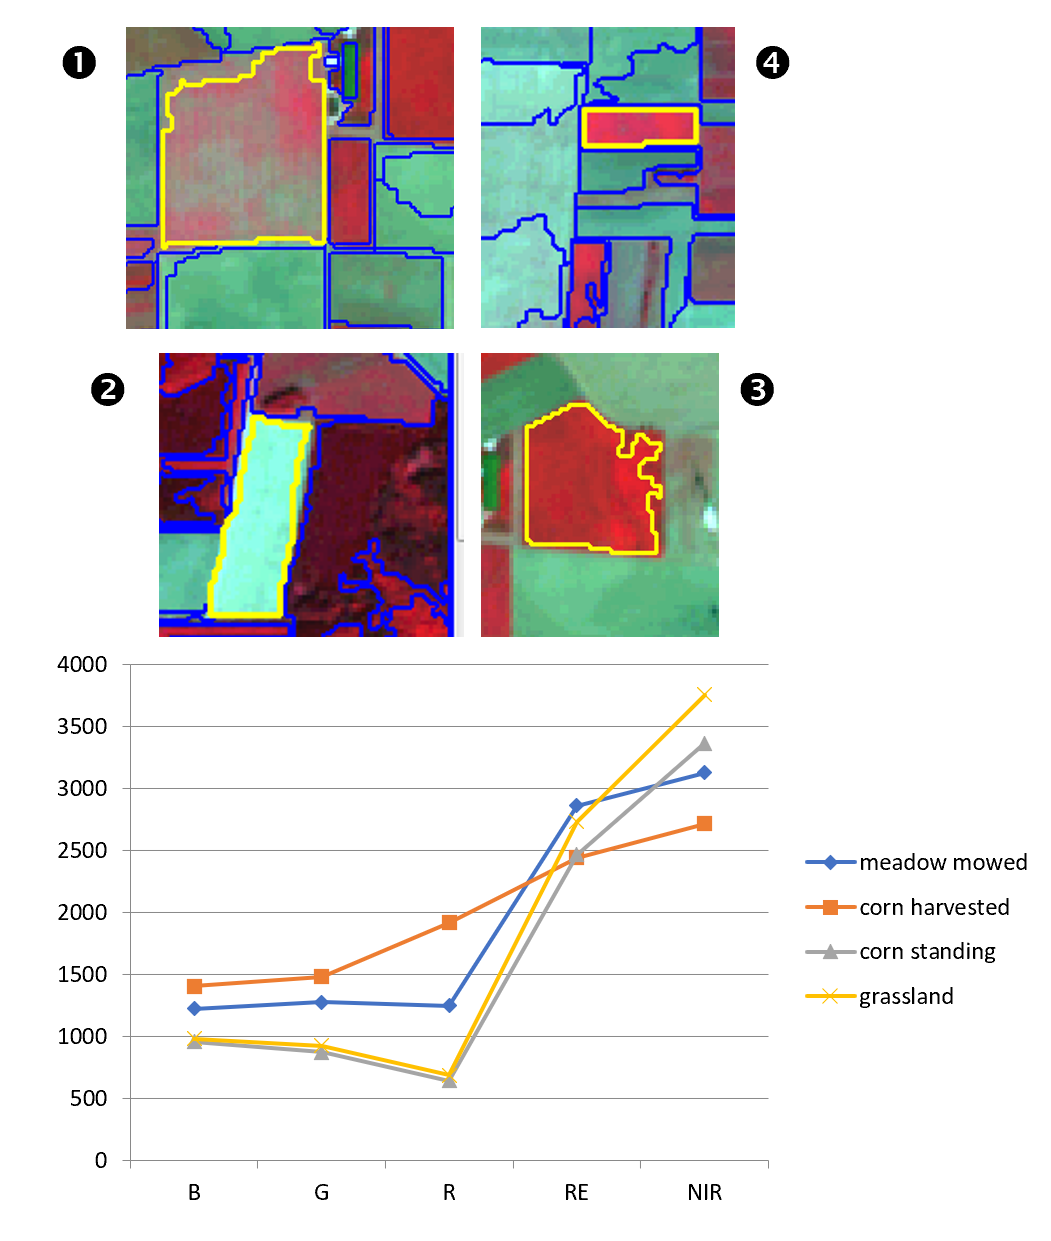
Spectral signatures of elements
- Spectral profiles are created by charting the object mean of representative class samples
- Profiles can be translated in rules
- Fuzzy rules can be applied to translate uncertainty in class descriptions
Multiscale class modelling
Defining an object’s body-plan
- A higher-level objects consists of …
- x% of object type A
- y% of object type B
- z% of …
Critical reconditions
- Elementary units need to be classified (‘Lego blocks’)
- Outline of composite object needs to be delineated
Multiscale class modelling
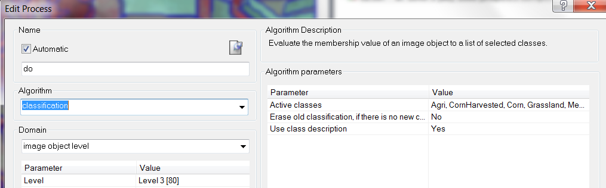
Specify set of target classes
- Define class descriptors
- Including non-target classes
- Perform classification
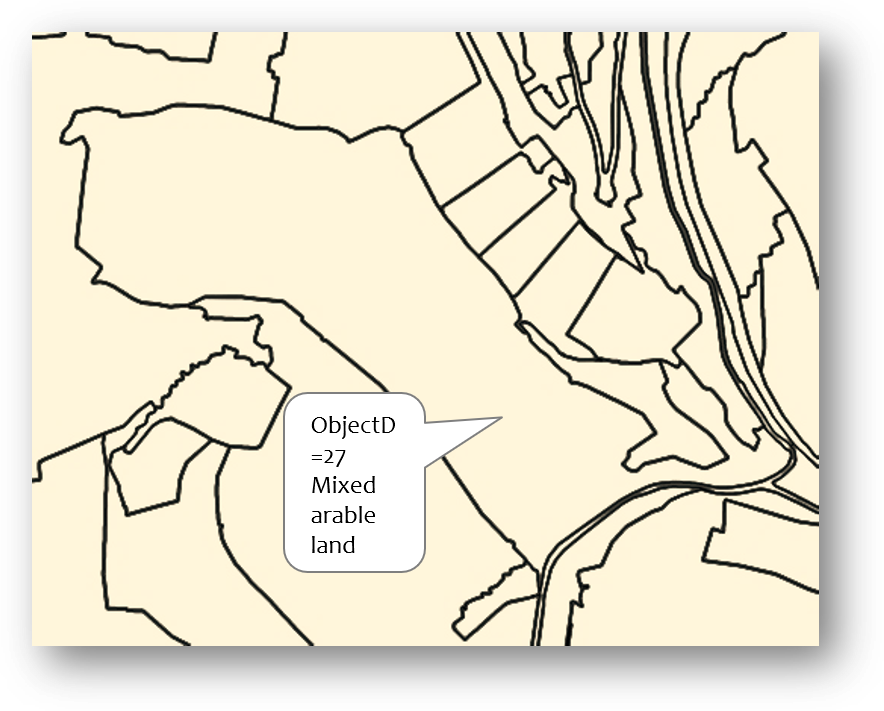
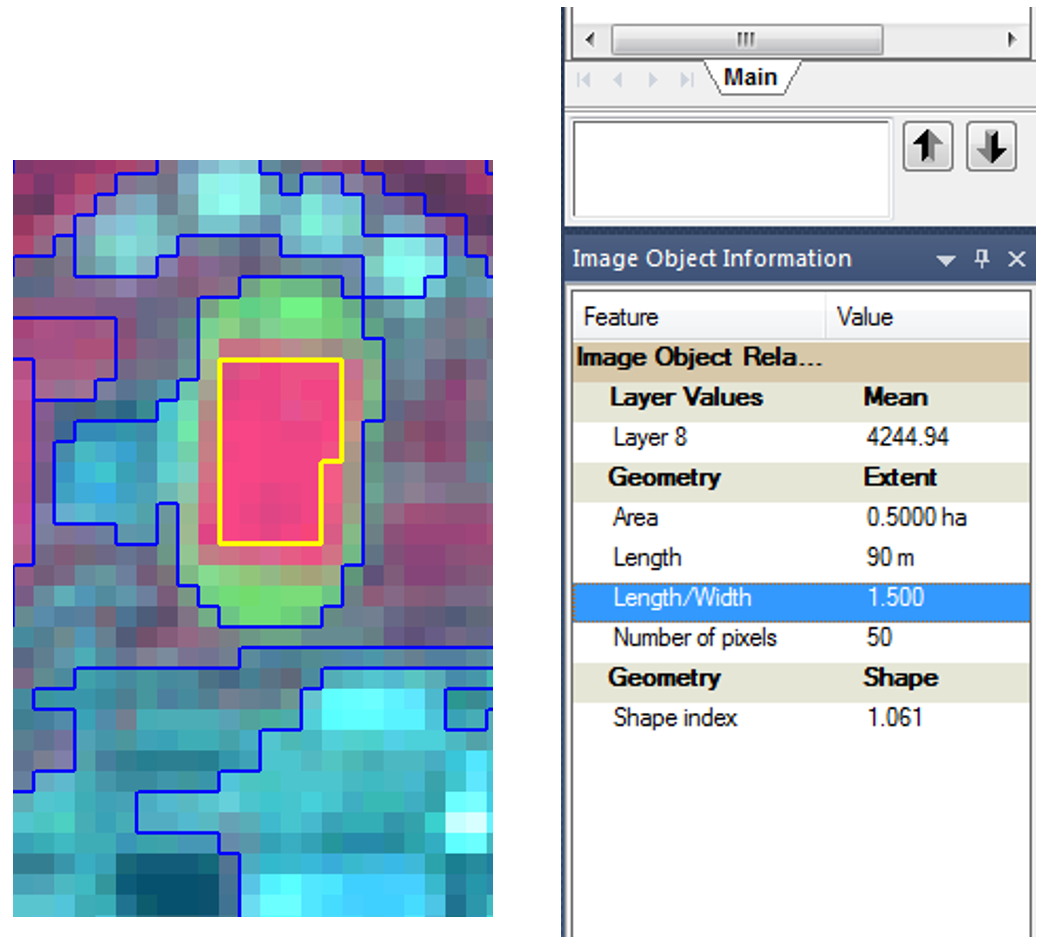
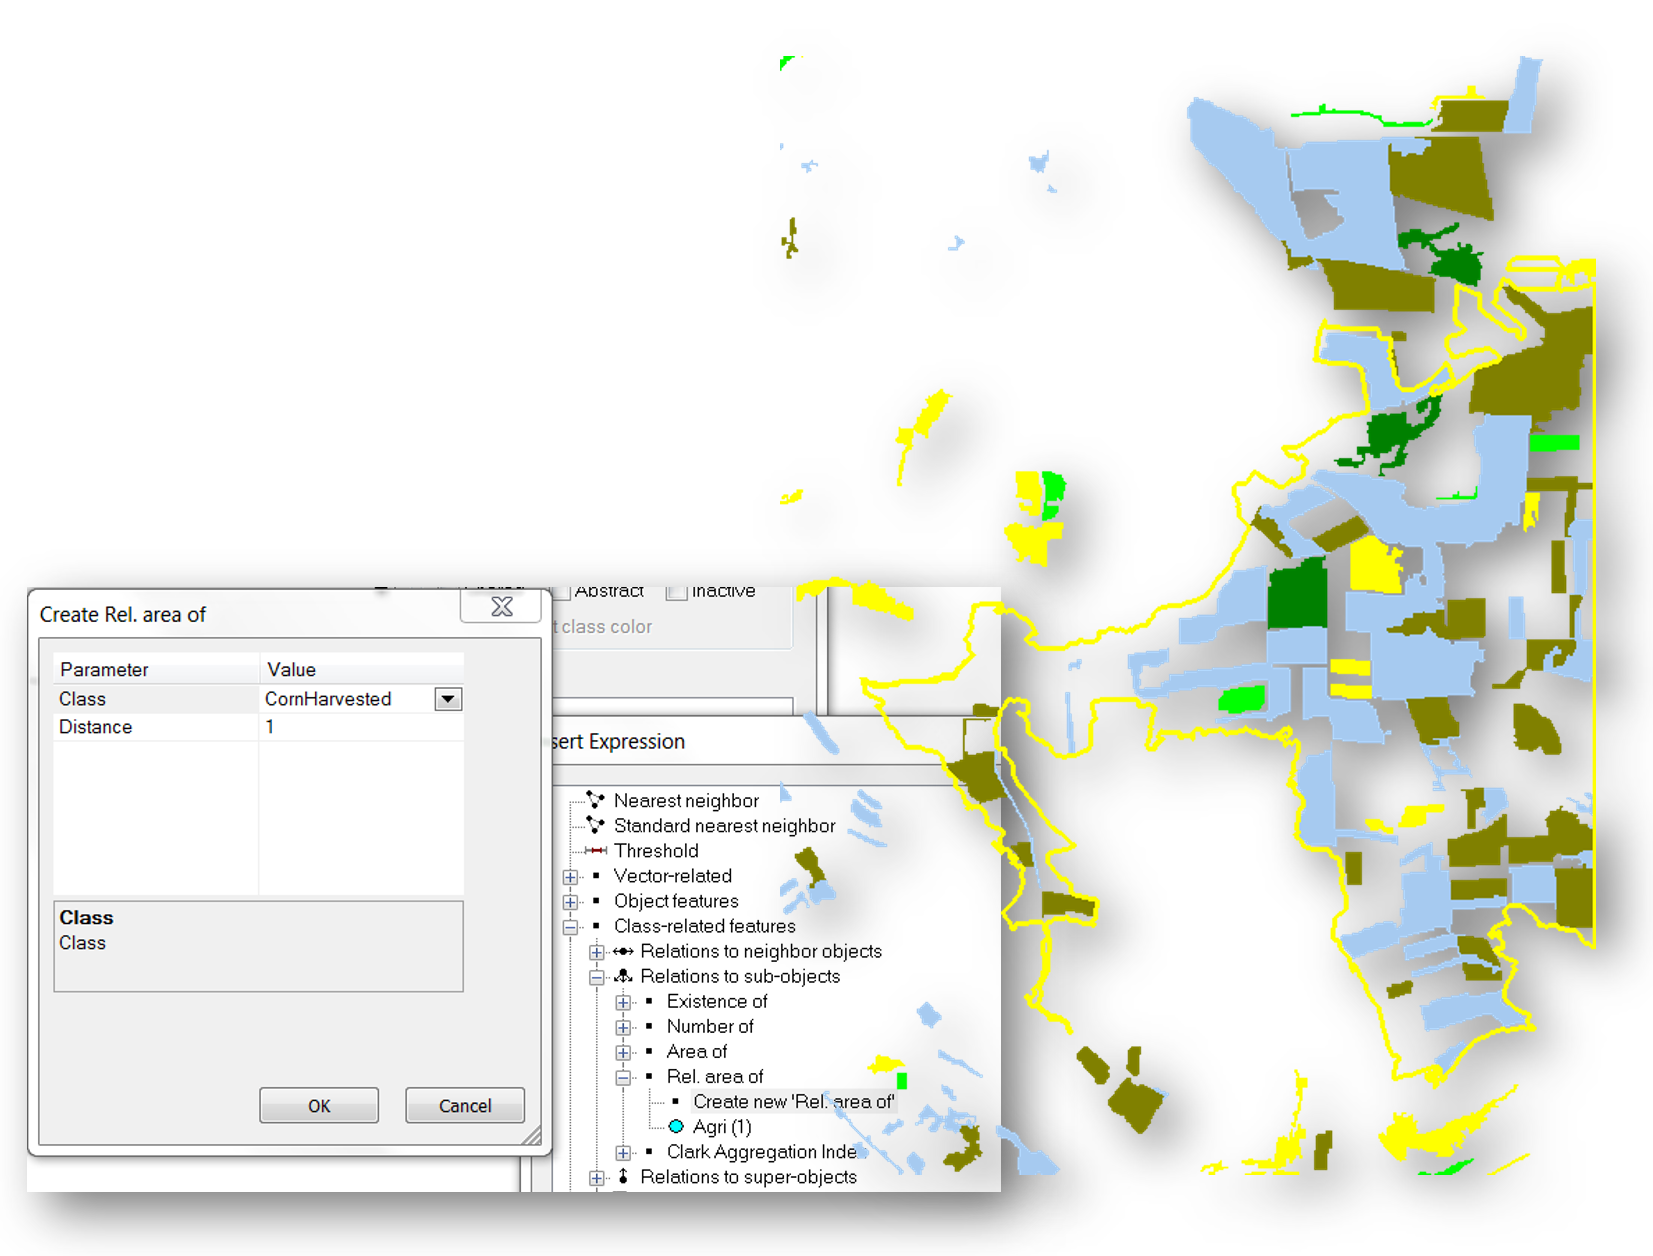
Multiscale class modelling
Composite object (yellow outline) consists of several components (sub-objects)
- Create customized feature
- Specify relative area of classified sub-objects
References
doi: 10.3390/ijgi8110474
doi: 10.1016/j.isprsjprs.2013.09.014
doi: 10.1016/j.isprsjprs.2013.09.014
Retrieved from: http://essential.metapress.com/content/15u6x2189425705l/