Identification of heat islands to support city planning
(A Geografiska Informationsbyrån and Epsilon Italia presentation)Introduction
This slidset addresses city planners and is about Urban Heat Islands and the importance of their identification in a spatial planning context. The slidset introduces the EO surface temperature maps, with their potential and their limitations.Learning outcomes
- Understand the importance of identifying UHIs in a spatial planning context (what are the consequences if, in a spatial planning context, the UHIs are not identified?)
- Understand how EO surface temperature time series can support identification of UHIs
- Understand how to interpret EO surface temperature time series to identify UHIs
- Understand how to derive maps from EO surface temperature data, to be integrated with other relevant information related to UHI identification in a spatial planning context
- Understand how to analyse information derived from EO surface temperature data integrated with other relevant information related to UHI identification in a spatial planning context
- Understand the limitations of the EO surface temperature data due to the spatial resolution
What are Urban Heat Islands?
- a difference in temperature of urban and suburban areas compared to their outlying rural surroundings
- E.g. the annual mean air temperature of a city with one million or more people can be 1 to 3°C warmer than its surroundings,
- Usually the difference decreases as city size decreases.
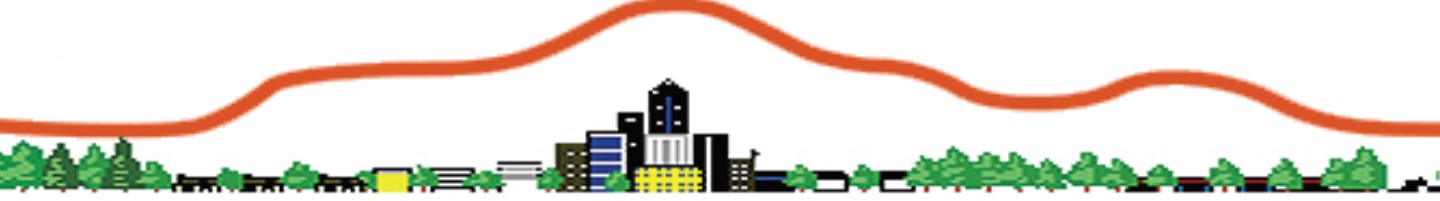
Urban Heat Island: the phenomenon
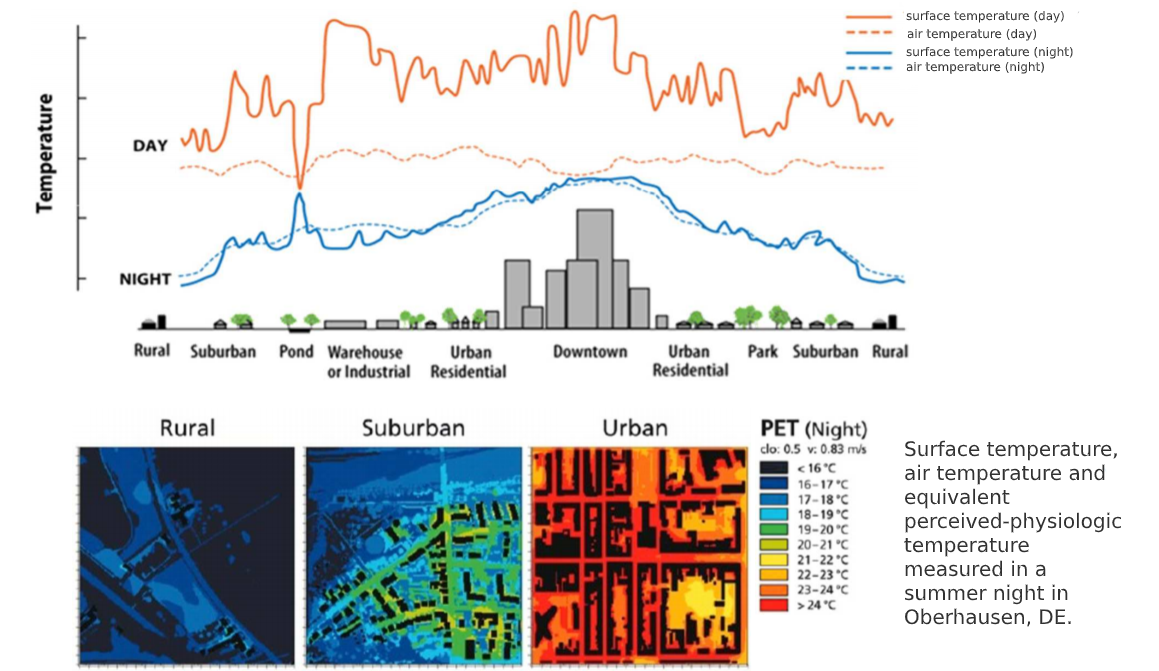
Source: M. Magoni, C. Cortinovis, «Interventi di mitigazione delle ondate di calore in contesti urbani», 2014
History:
Urban heat islands have been recognized and described a long time ago:
“The generally higher temperatures inside towns have been noted for a long time, indeed Luke Roward (Roward, 1818),
a pioneer of urban climatology though more famous for his work on cloud classification, first measured temperature
differences in London as early as 1809. And yet, in spite of the numerous studies in urban temperatures, it still remains
to quantify, even relatively, the heat exchange mechanisms leading to the excess heat of towns. There are obviously
four contributory factors: changes in the thermal characteristics (albedo, heat conductivity and thermal capacity) of the
surface following the substitution of buildings and roads for farms and fields; changes in the airflow patterns with a
reduced diffusion of heat from streets and courtyards; changes in evaporation rates and heat losses and, the heat
added by humans and human activities. These seem to be of differing importance in different cities so that the
character of temporal variations also varies. In many cities of western Europe, heat islands are strongest in summer
whilst in central and northern Europe there is, apparently, little difference between summer and winter intensities. In
several Japanese cities, maximum heat island intensities occur in winter.”
(T. J. Chandler, Urban climatology - Inventory and prospect, Urban climates: proceedings of the WMO Symposium on Urban Climates and Building Climatology, WMO, 1970)
Why analyse urban heat islands?
- Increased Energy Consumption
- Elevated Emissions of Air Pollutants and Greenhouse Gases
- Compromised Human Health and Comfort
- Impaired Water Quality
(Heat Island Impacts, https://www.epa.gov/heat-islands/heat-island-impacts ; 'Heat island' effect could double climate change costs for world's cities, https://phys.org/news/2017-05-island-effect-climate-world-cities.html )
The consequences of Urban Heat
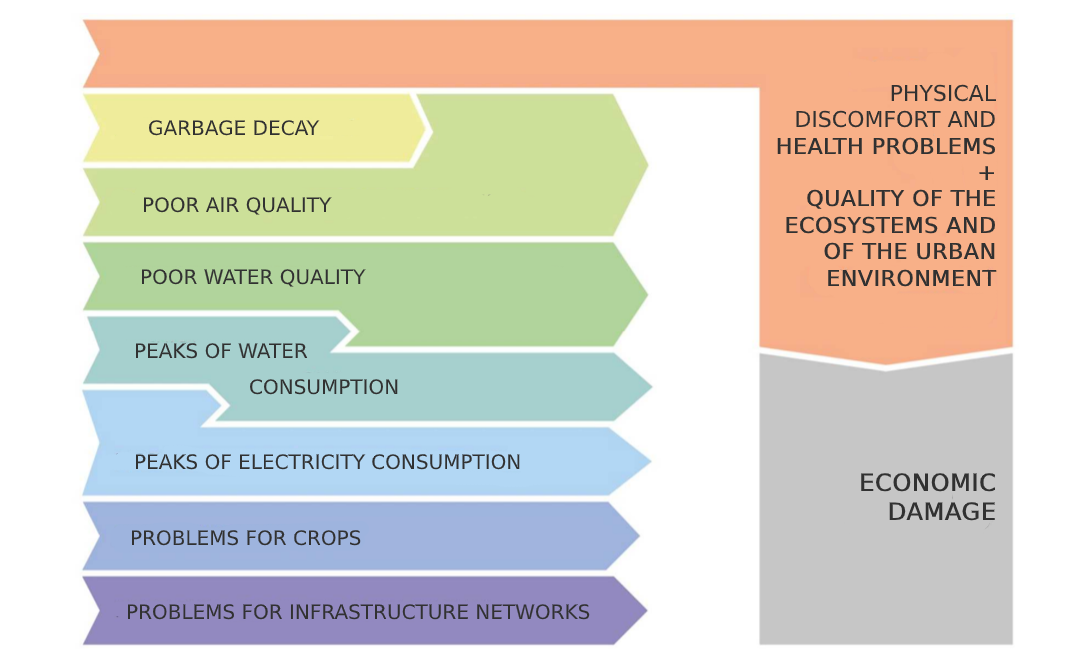
Source: M. Magoni, C. Cortinovis, «Interventi di mitigazione delle ondate di calore in contesti urbani», 2014
State of the art:
Recently, the dependency of UHI on a city’s layout could be shown:
“The arrangement of a city's streets and buildings plays a crucial role in the local urban heat island effect, which causes
cities to be hotter than their surroundings, researchers have found. The new finding could provide city planners and
officials with new ways to influence those effects.
Some cities, such as New York and Chicago, are laid out on a precise grid, like the atoms in a crystal, while others such
as Boston or London are arranged more chaotically, like the disordered atoms in a liquid or glass. The researchers
found that the "crystalline" cities had a far greater buildup of heat compared to their surroundings than did the "glass-
like" ones.
The study […] found these differences in city patterns, which they call "texture," was the most important determinant
of a city's heat island effect.”
(Urban heat island effects depend on a city's layout, https://phys.org/news/2018-02-urban-island-effects-city-layout.html
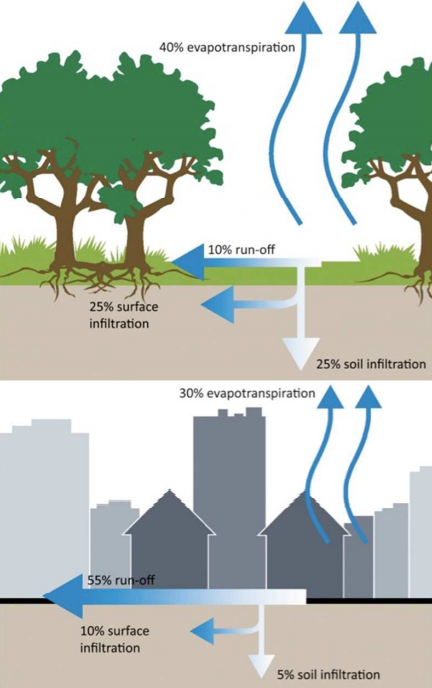
3 causes of UHI
1) Physical/material factors
2) Morphological factors
3) Anthropogenic factors
Presence of green areas
 |
causes and effects
|
Issues to address
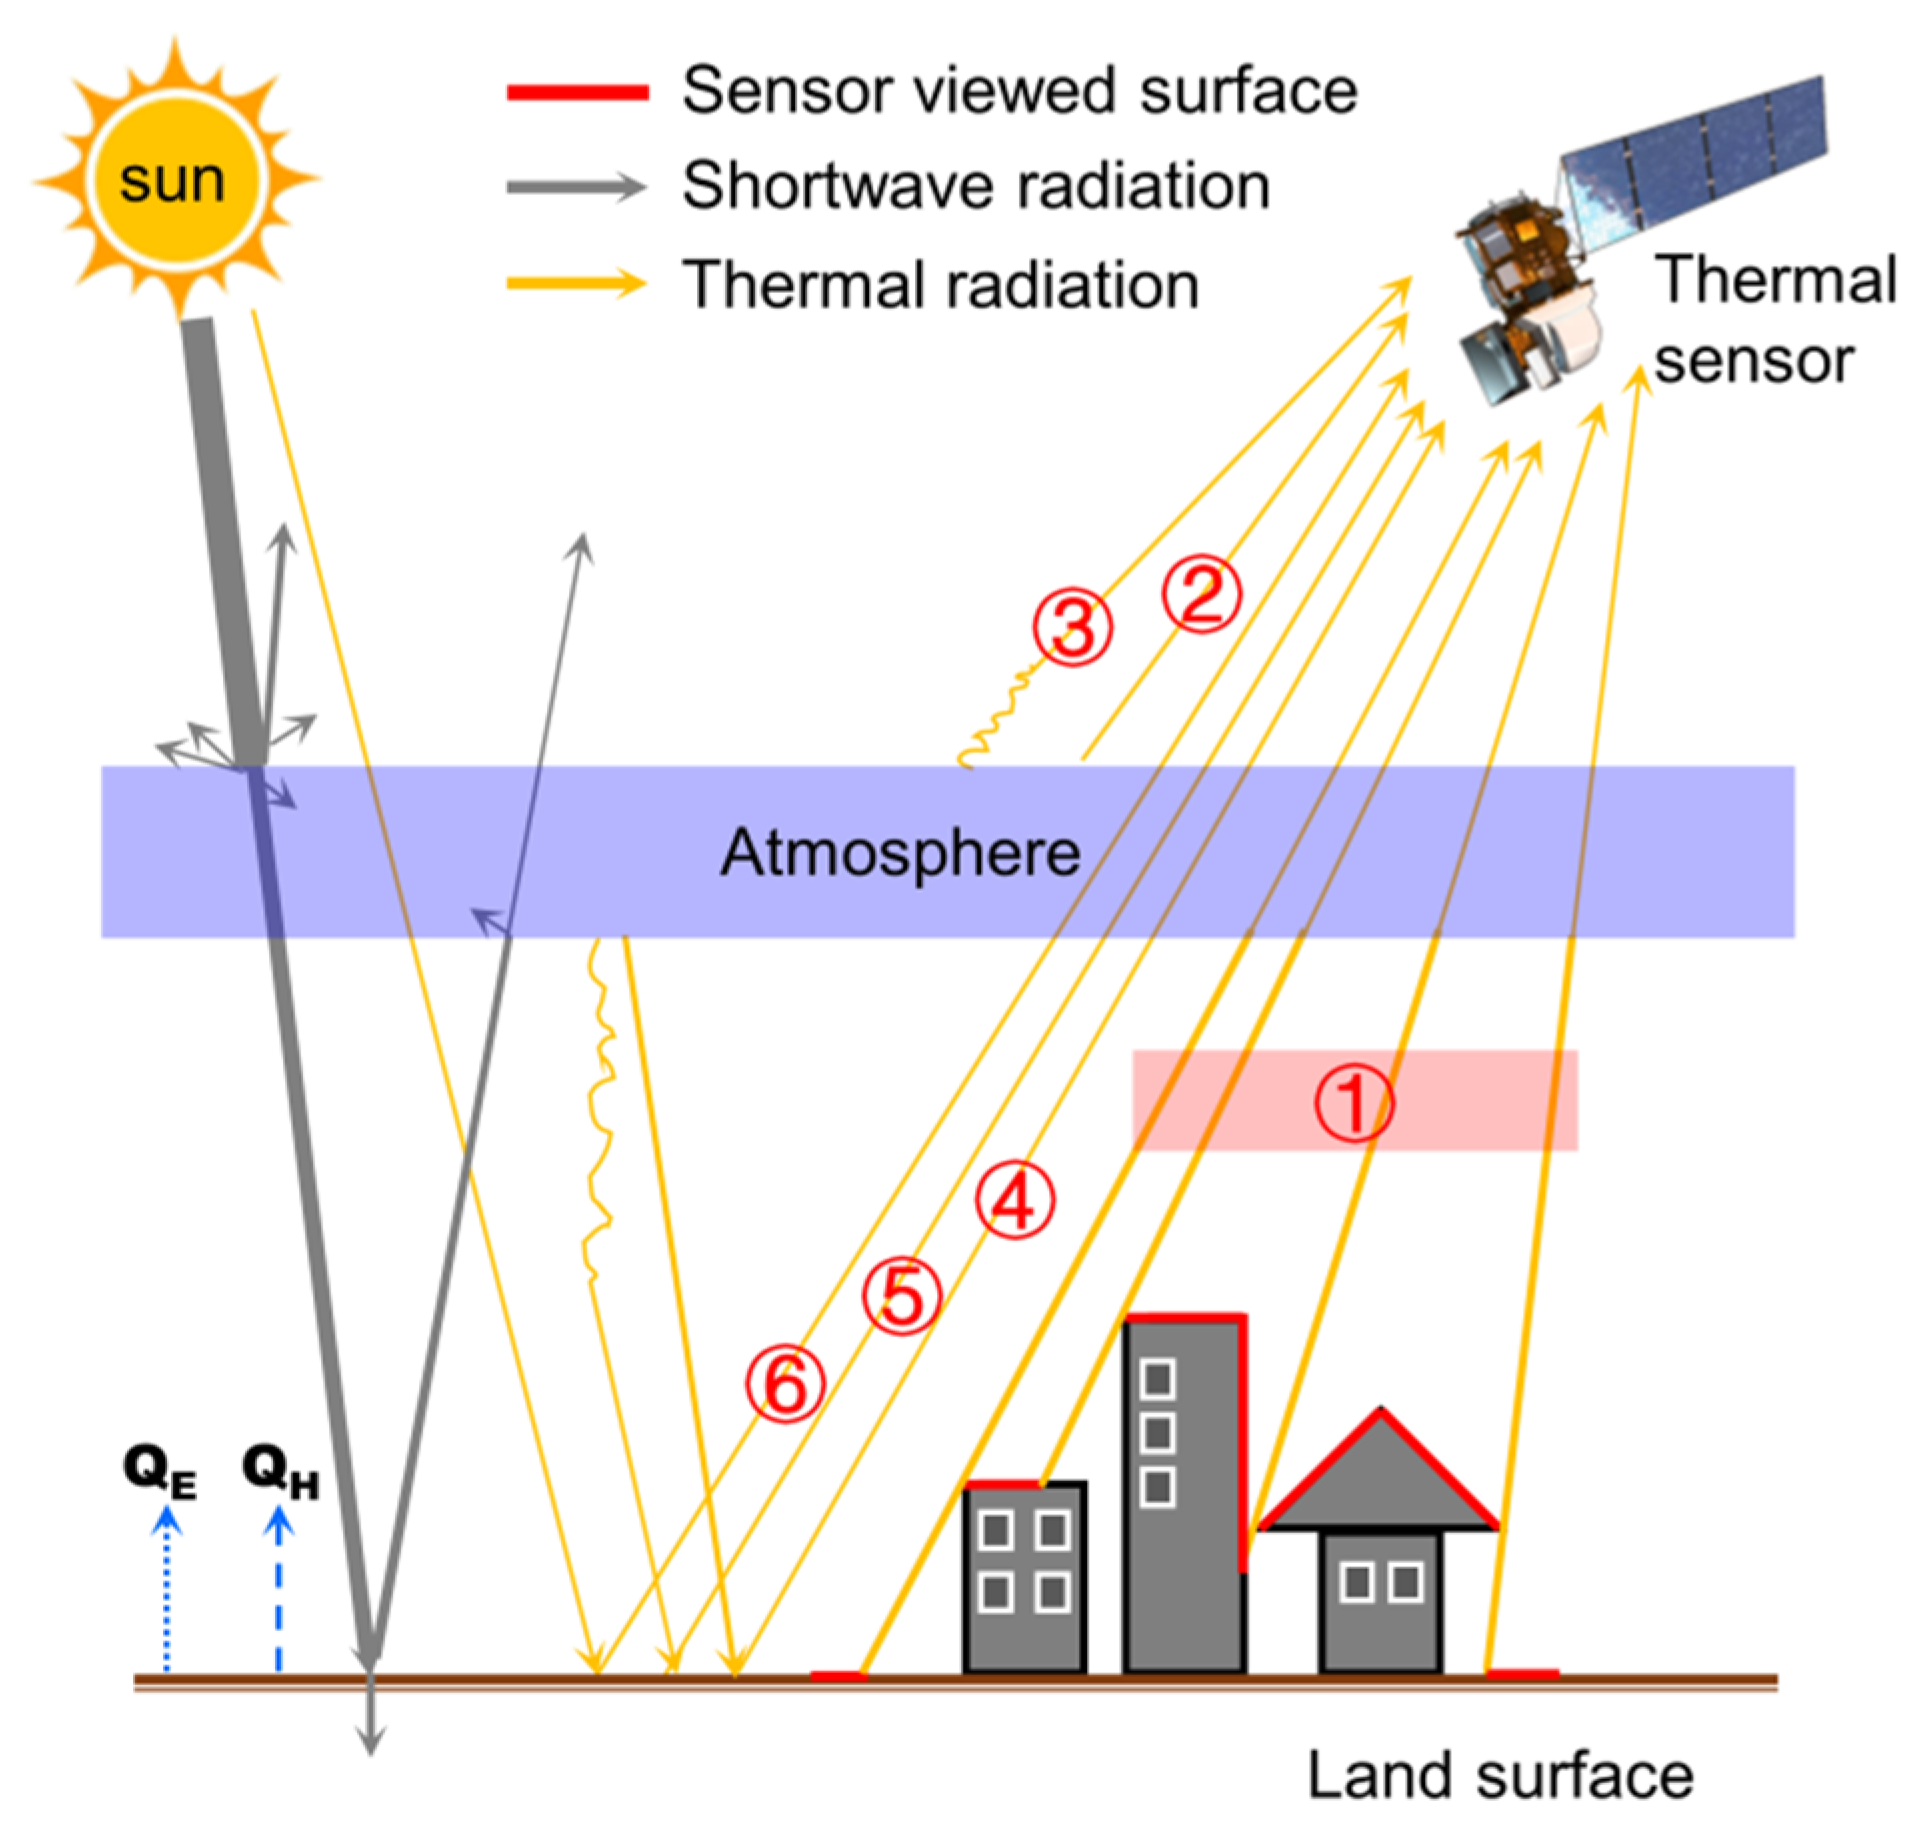
How to analyse urban heat islands?
To detect UHIs it is used the land surface temperature (LST). Be aware that
this is not equal to the air temperature that people will experience in that place. However, it is a good and easy-to-access indicator.
It is possible to use data from Sentinel-3, which has thermal bands included and thus
provides LST. Another alternative would be Landsat-8 which has a higher resolution
(Sentinel-3: 500m, Landsat-8: 100m).
Remote sensing
- the acquisition of information about an object or phenomenon without making physical contact
- used in numerous fields, including geography, land surveying and most Earth science disciplines (for example, hydrology, ecology, meteorology, oceanography, glaciology, geology); it also has military, intelligence, commercial, economic, planning, and humanitarian applications.
- repeating satellite orbits enable continuous monitoring of the object, phenomenon or area in general, i.e. gathering EO time series
EO time series
- Efficiently provide information on
- Land cover change
- Vertical and horizontal land movements
- Sea level change
- Ice sheet balance change
- Temperature change over the season or different time
- Specific events such as fires, floods, landslides, earthquakes, etc.
- Enable global and local analysis (such as detecting and monitoring Urban Heat Islands, UHIs)
EO time series for UHI monitoring
|
 |
Vegetation – UHI relationship
- More the vegetation less the UHI effect
- Methods on quantifying this
- NDVI (Normalized Difference Vegetation Index)
- Vegetation fraction
- LAI (Leaf Area Index)
- Other methods
- Handheld temperature sensors
- Aerial temperature measurements
Vegetation – UHI relationship
|
NDVI Numerical indicator showing live green vegetation NDVI = (NIR – RED) / (NIR + RED) |
|
Vegetation fraction Derived from spectral mixture model Uses LSMA to determine vegetation – at sub-pixel level Sometimes more accurate than NDVI |
|
LAI Can be computed from NDVI Can be derived from field measurements (collection of leaf litterfall or destructive harvesting of leaves within a vertical column passing upward through the entire tree canopy) |
Learn more...
- About remote sensing - see presentation
- About Sentinel-2 data and vegetation indices - see presentation
- About EO data sources - see presentation
- About Copernicus services - see website
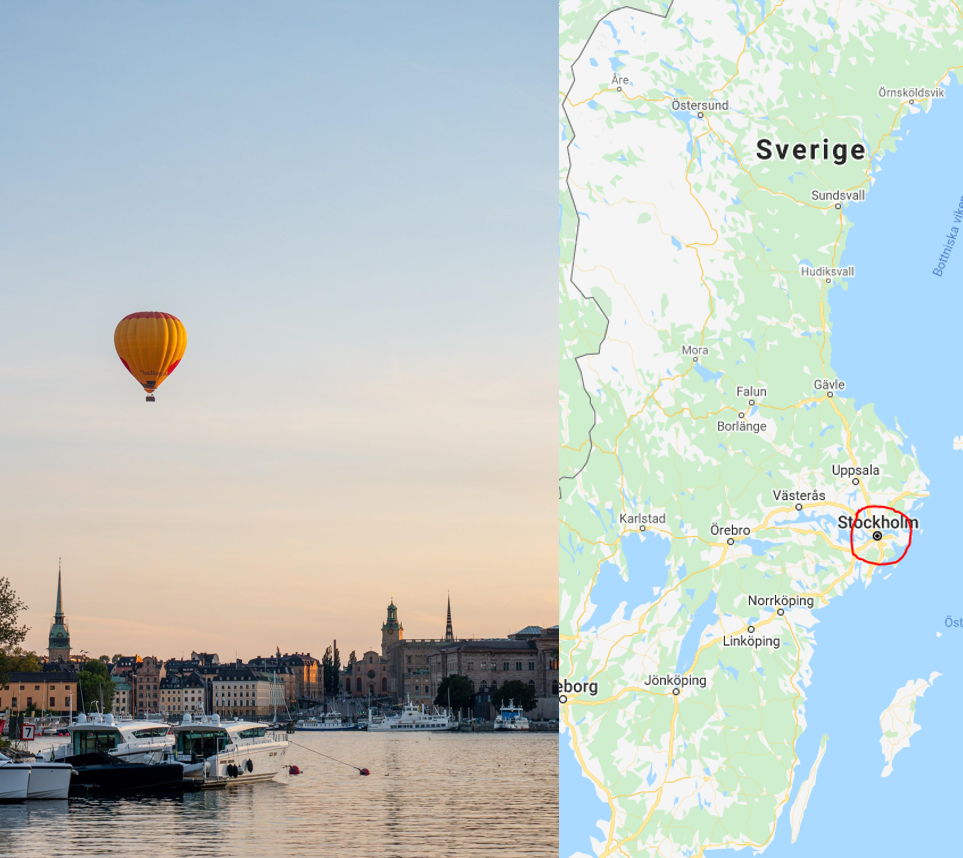
Case: City of Stockholm, Sweden
|
 |
|
What are we going to do?
- Screening of the city for LHI
- Using surface temperature maps
- Using time series
- Make statistic measures from time series
- Max temp
- Mean temp
- Locate and delineate main LHI
- Locate cool structures
- Describe how this can be related to planning issues
Data
|
 |
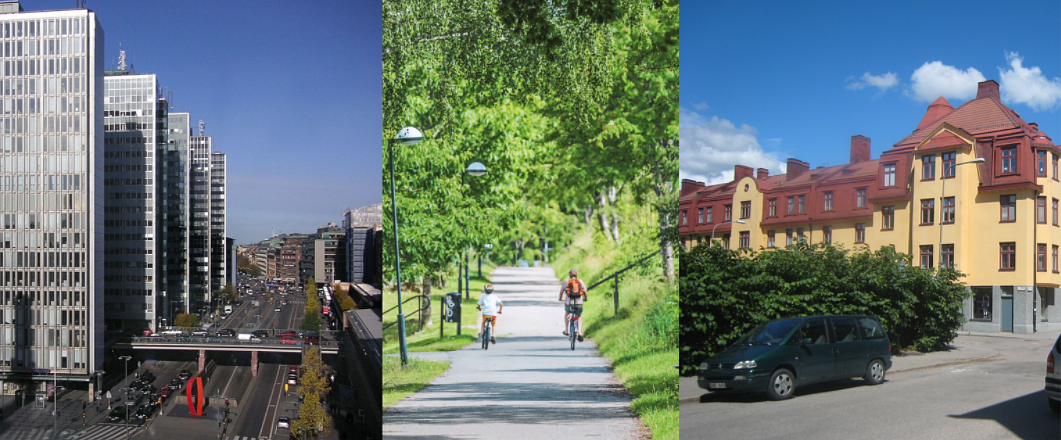
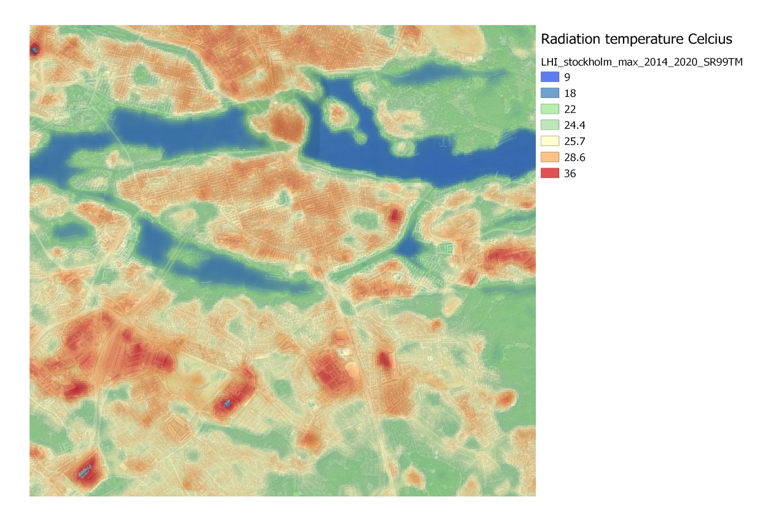
Description of the selected case
Residential areas and people living in or close to LHI
Surface heat temperature map 2014-2020, Time series.
|
|
|
 |
|
|
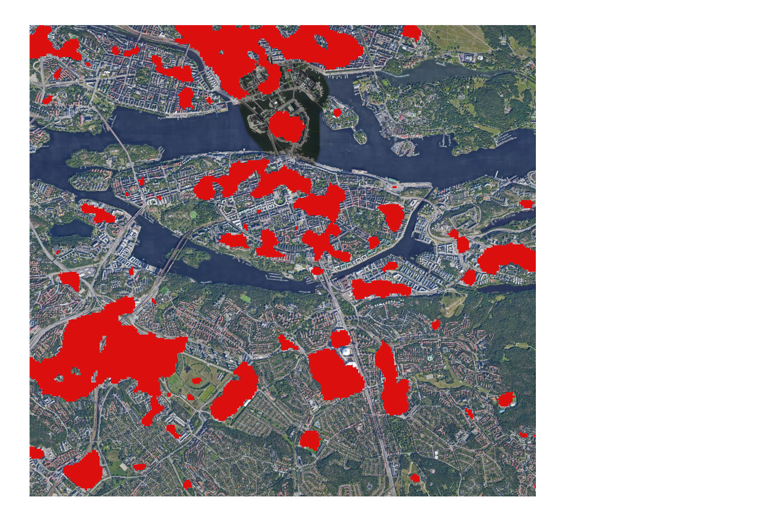
Local Heat islands are delineated > 28°C |
|
|
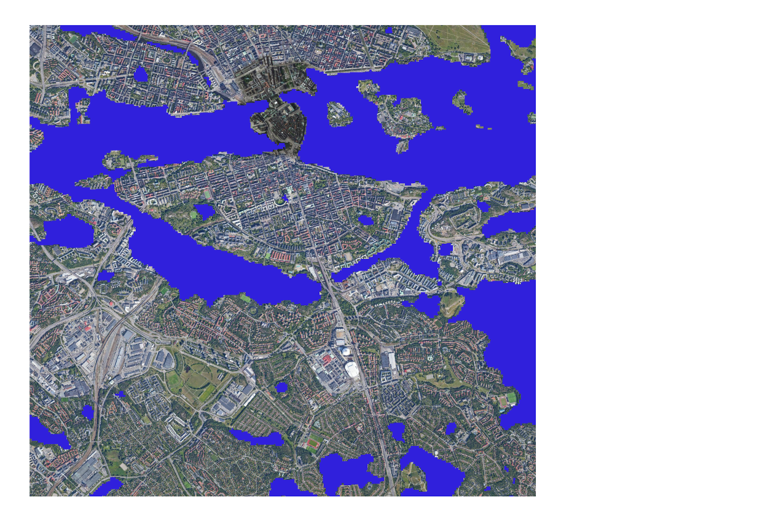
Cool structures are delineated < 22°C Mostly water and forested areas |
|
|
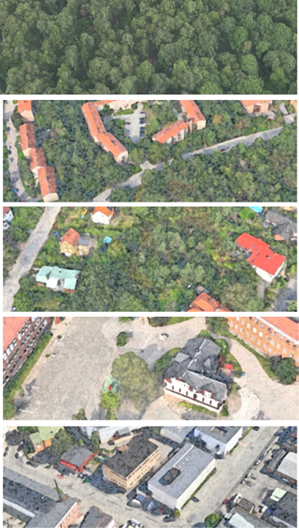
Green structures - GIS layer from land cover mapping |
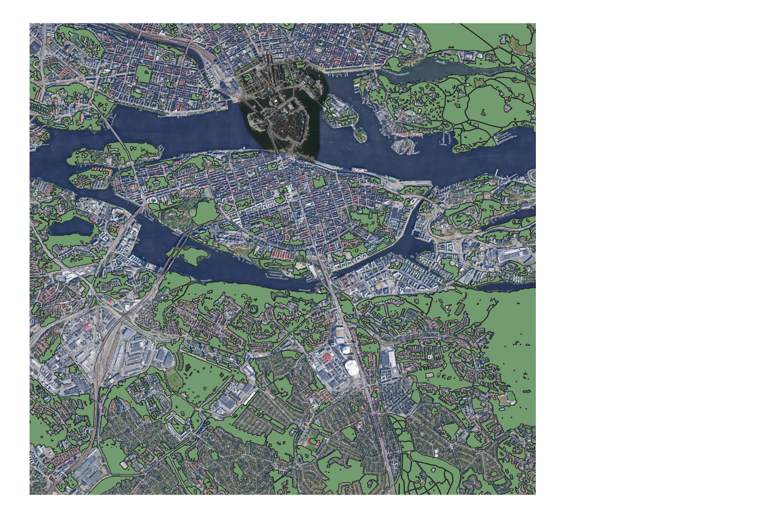
|
|
GIS layer with buildings |
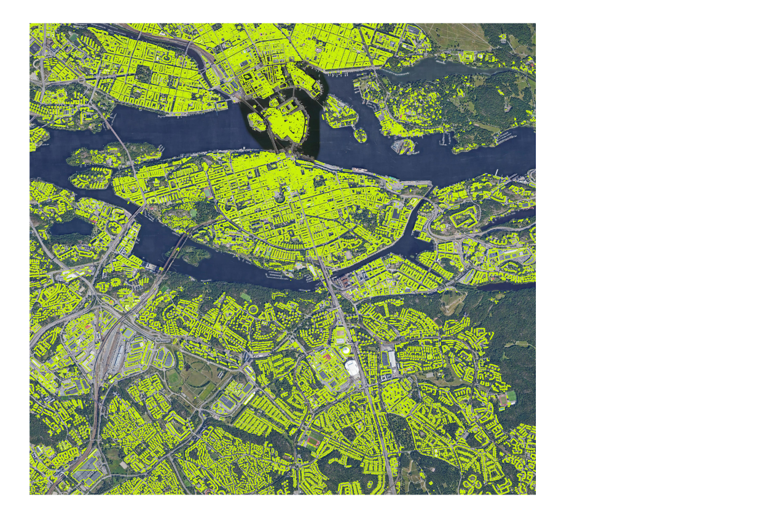
|
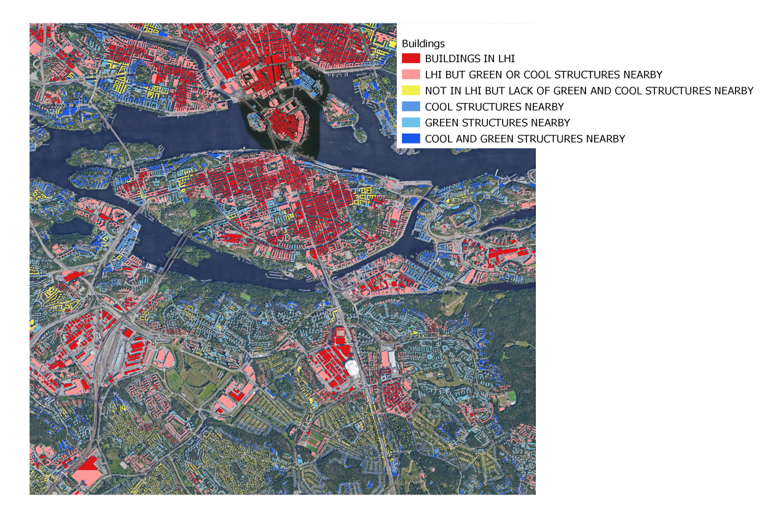
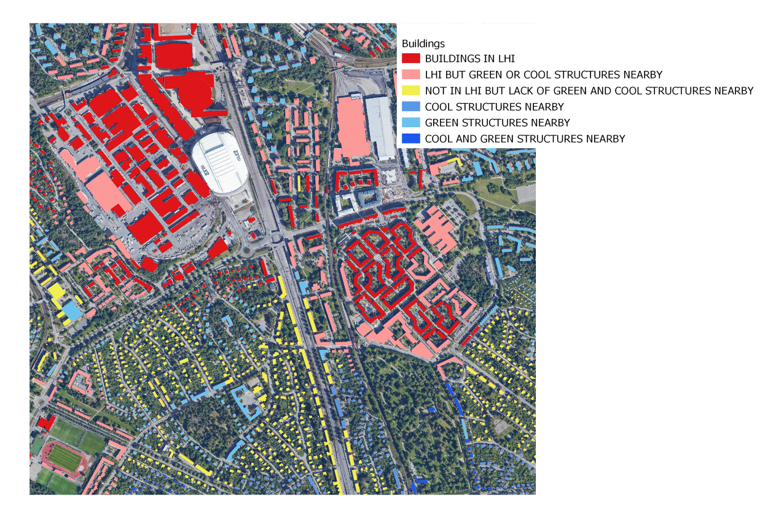
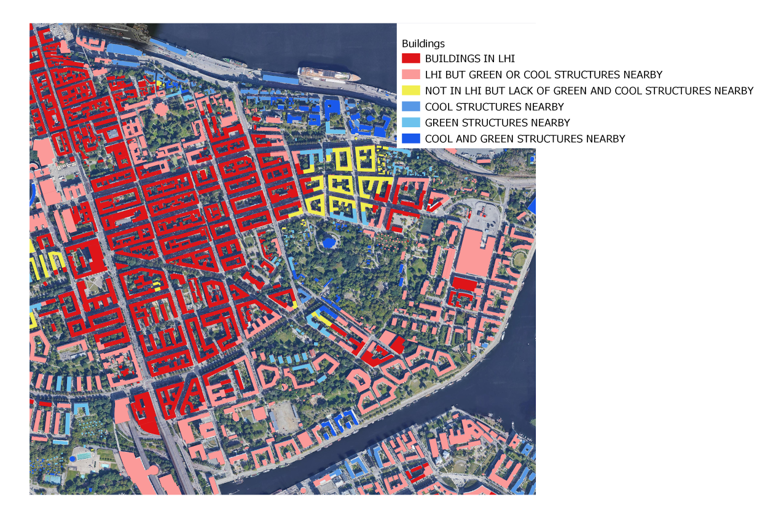
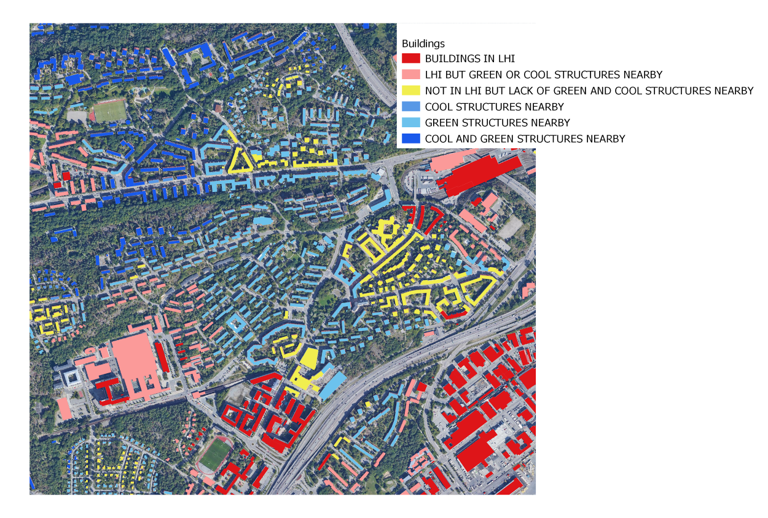
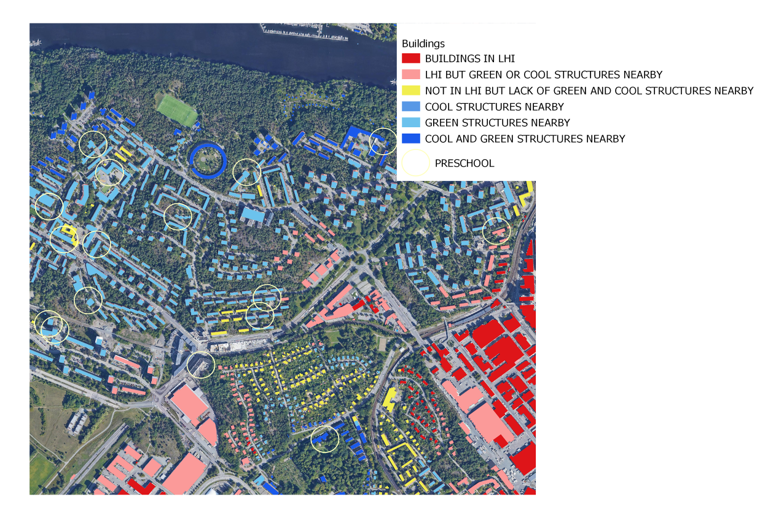
Assessing the impact of LHI by the use of Surface temperature data and GIS-layers
-
Buildings within LHI
- No green or cool structures nearby (>100m)
- Green or cool structures nearby (<100m)
-
Buildings outside LHI
- No green or cool structures nearby (>100m)
- Cool and green structures nearby (<100m)
- Green structures nearby (<100m)
- Cool structures nearby (<100m)
|
Southeast of city
|
Planning takeaways: Caution - Residents in red areas can be affected by heat stress and little access to green or cool structures |
|
Inner city south
|
Planning takeaways: Caution - Population in red areas can be affected by heat stress and little access to green or cool structures |
|
Southwest of city
|
Planning takeaways: |
|
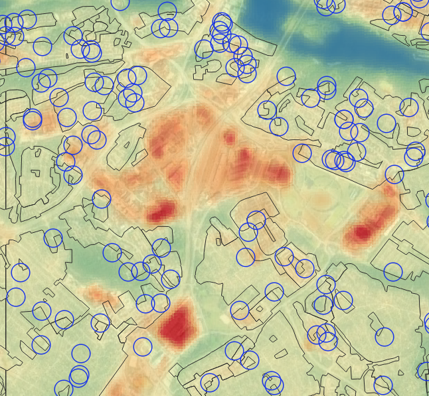
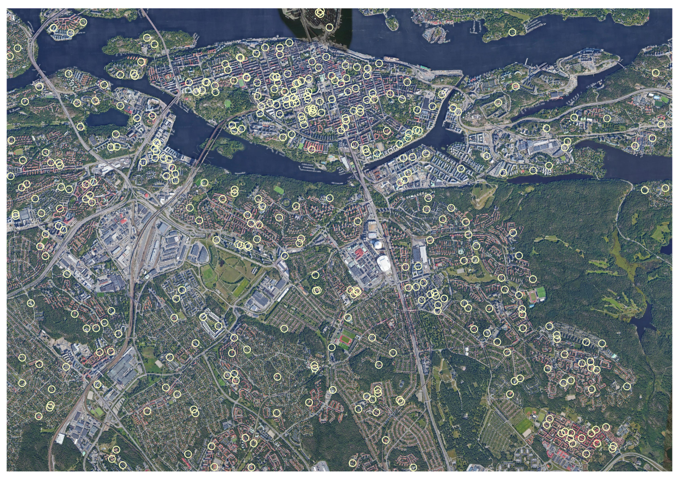
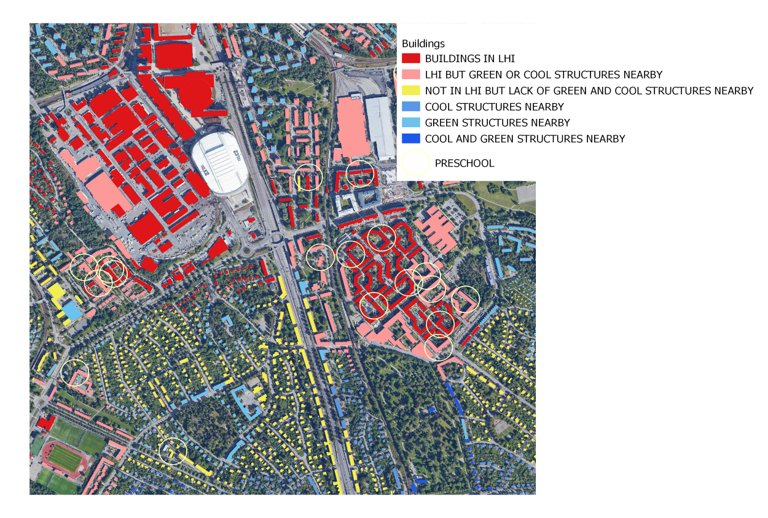
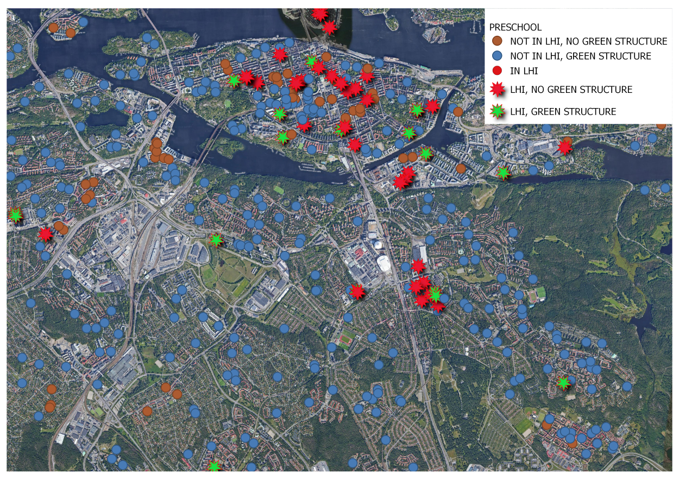
Situation of the preschools in Stockholm
|
Location of preschools in South Stockholm |
|
Southeast of city
|
Planning takeaways: Caution - many Preschools within or close to LHI - lack of access to green structures |
|
Southwest of city
|
Planning takeaways: Better situation with preschools mostly outside of LHI and better access to green structures |
|
|
Planning takeaways |
|
Conclusions / Recap
Conclusions / Recap
Conclusions / Recap
Conclusions / Recap
- Examples of planning takeaways
- Avoid further soil sealing and densification in areas close to heat islands
- Increase the share of green areas in certain “Hot spots” in the urban environment
- Access to green and cool structures may be even more important for residents in areas exposed to urban heat
- Special consideration should be given to sensitive groups such as elderly, preschool children, etc
Limitations of data
“One of seven priority goals in The City of Stockholm Environment programme 2020-2023, is a climate-adapted Stockholm. Working with climate adaption and urban heat issues, we need to integrate many different data sources to further increase our knowledge. Surface temperature measurements from satellite can together with data on e.g. census, land use and urban planning be an important tool for improving our basis of decision.”
Peter Wiborn, Senior Project Manager - Ecosystem Services, Environment and health department, City of Stockholm
Thank you!

|
www.eo4geo.eu |

|
@EO4GEOtalks |

|
https://www.geografiska informationsbyran.se/ |

|
https://www.epsilon-italia.it/ |