EO for urban greenery management
|
The presentation is also available in: |
|
Polish |
Table of content
EO for urban greenery management
| 1 | Introduction |
| 2 | Ecosystem services |
| 3 | Remote sensing data |
| 4 | Warsaw case study |
| 5 | Questions and answers |
Introduction
to the webinar

UNEP/GRID-Warsaw Centre
Since 1991 we have been working for sustainable development, fulfilling the mission of the United Nations Environment Programme (UNEP) in Poland being a part of the GRID network, embedded in the Science Division of the UN Environment Programme.
EO4GEO is an ERASMUS+ Sector Skills Alliance
Sector Skills Alliances are transnational projects which aim to tackle skills gaps with regard to one or more occupational profiles in a specific sector through a coherent and comprehensive set of activities and outputs.

Learning outcomes
EO for urban greenery management
Main learning outcomes
The participants of the webinar:
- Understand how to acquire data on urban greenery using remote sensing methods
- Understand how the data acquired can be used to improve urban greenery management, especially in the context of climate change adaptation
- Get to know the concepts of remote sensing and where to look for satellite data
Importance
This topic is in line with many strategies
and other policy documents, such as:
- European Green Deal
- EU Biodiversity Strategy for 2030
- Green Infrastructure (GI) - Enhancing Europe’s Natural Capital
- SPA 2020 - a strategic adaptation plan for sectors and areas sensitive to climate changes by 2020, with an outlook by 2030
- National Urban Policy 2023
- The 2030 National Environmental Policy

European Green Deal
The most important proposed objectives are:
- Adopting a binding climate neutrality target by 2050
- Revision of the short-term target
It provides an action plan to:
- Boost the efficient use of resources
- Restore biodiversity and reduce pollution
EU Biodiversity Strategy for 2030
It assumes the synergy of actions to combat the climate crisis, among others through actions to protect biodiversity, presented in the EU Biodiversity strategy until 2030.
EU Nature Restoration Plan (key commitments by 2030) includes Urban Greening Plan for cities with at least 20,000 inhabitants.
Ecosystem services
provided by urban vegetation
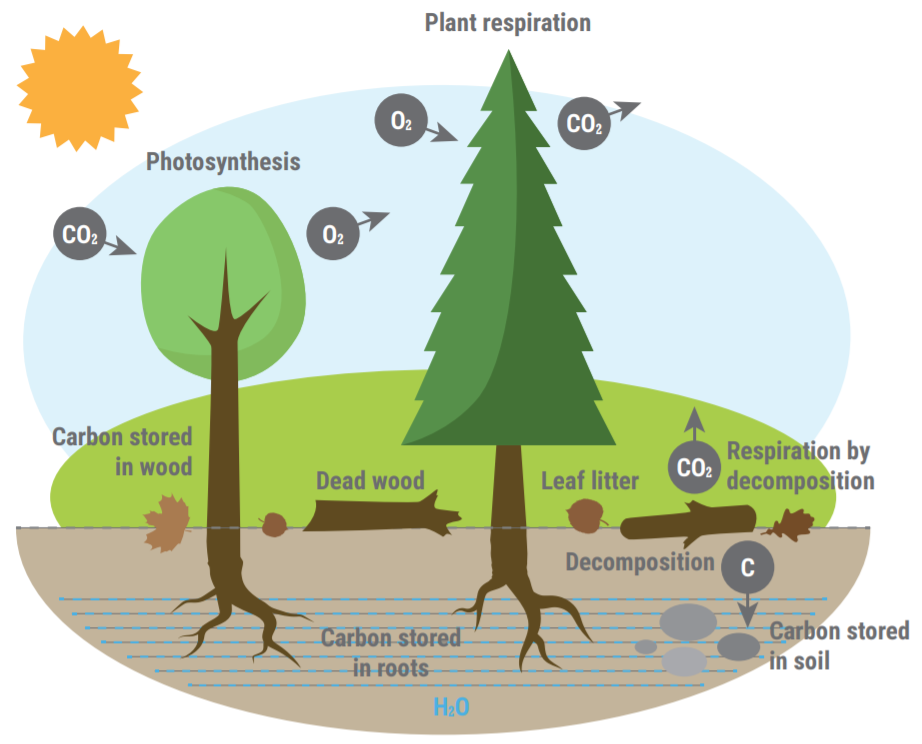
Carbon control
50% of dry weight of a tree comes from the carbon present in the atmosphere as carbon dioxide
When trees die the carbon goes back to the atmosphere
Urban trees act as "carbon sink”
However, carbon sequestration (climate mitigation) is not the key ecosystem service of urban trees
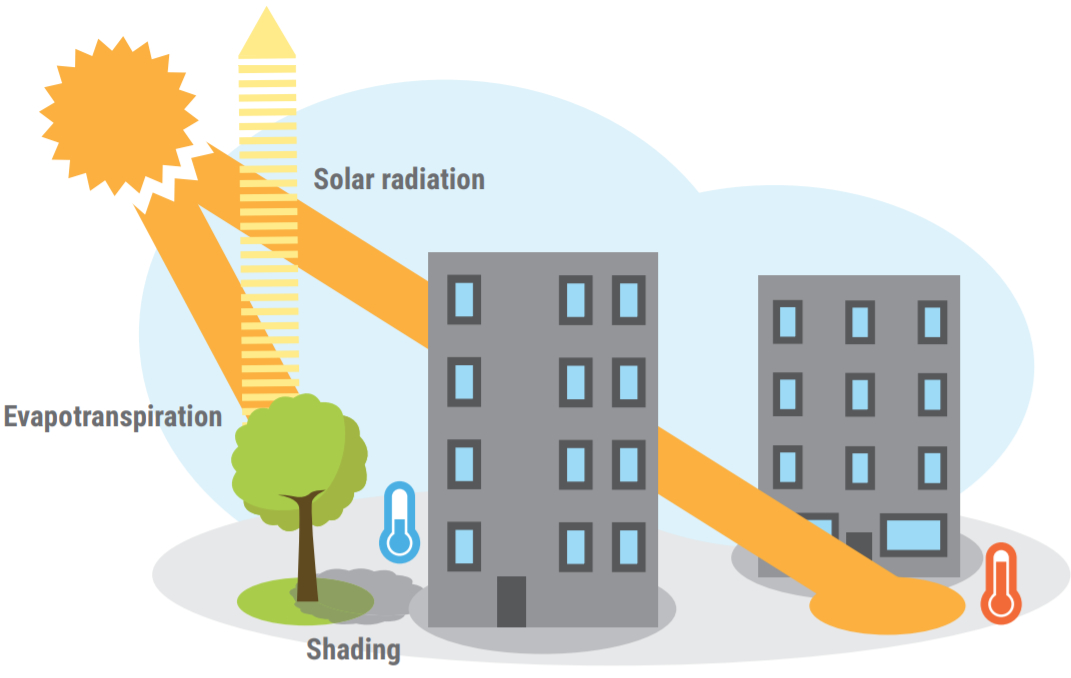
Local climate control
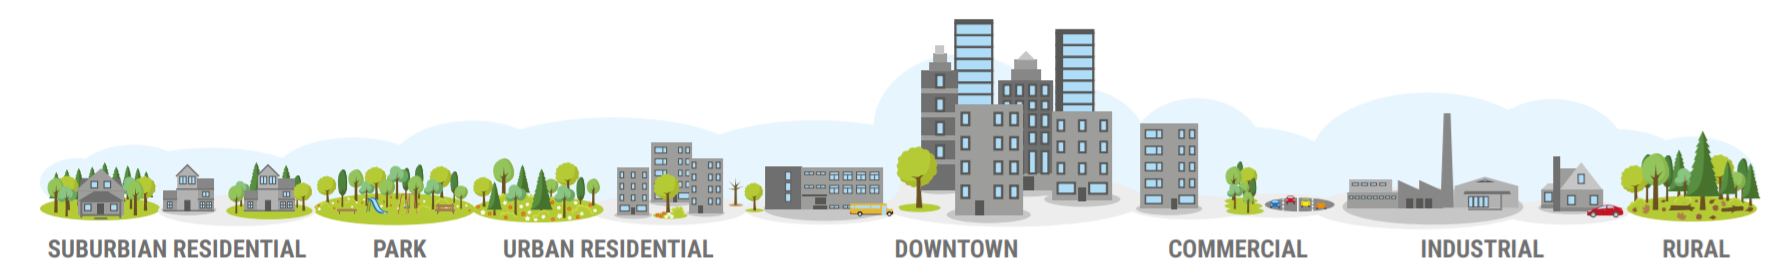
Urban Heat Island (UHI) occurs when the city proper records are much higher temperatures than nearby rural areas
Trees reduce the UHI in the summer period by:
- Evapotranspiration
- Deflection of solar radiation
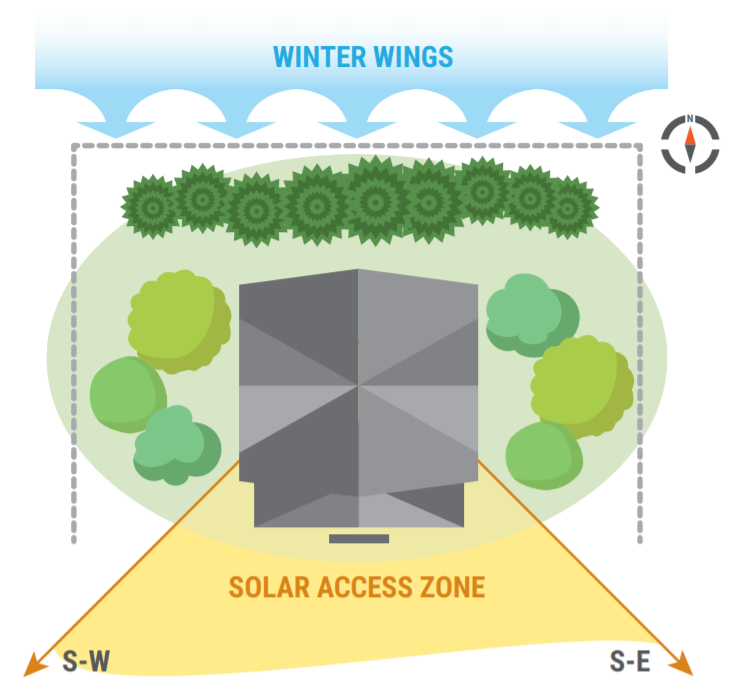
Energy conservation
Trees provide shade and block wind
Potential energy conservation results:
- Heating savings (MBTU and Kwh)
- Cooling savings (Kwh)
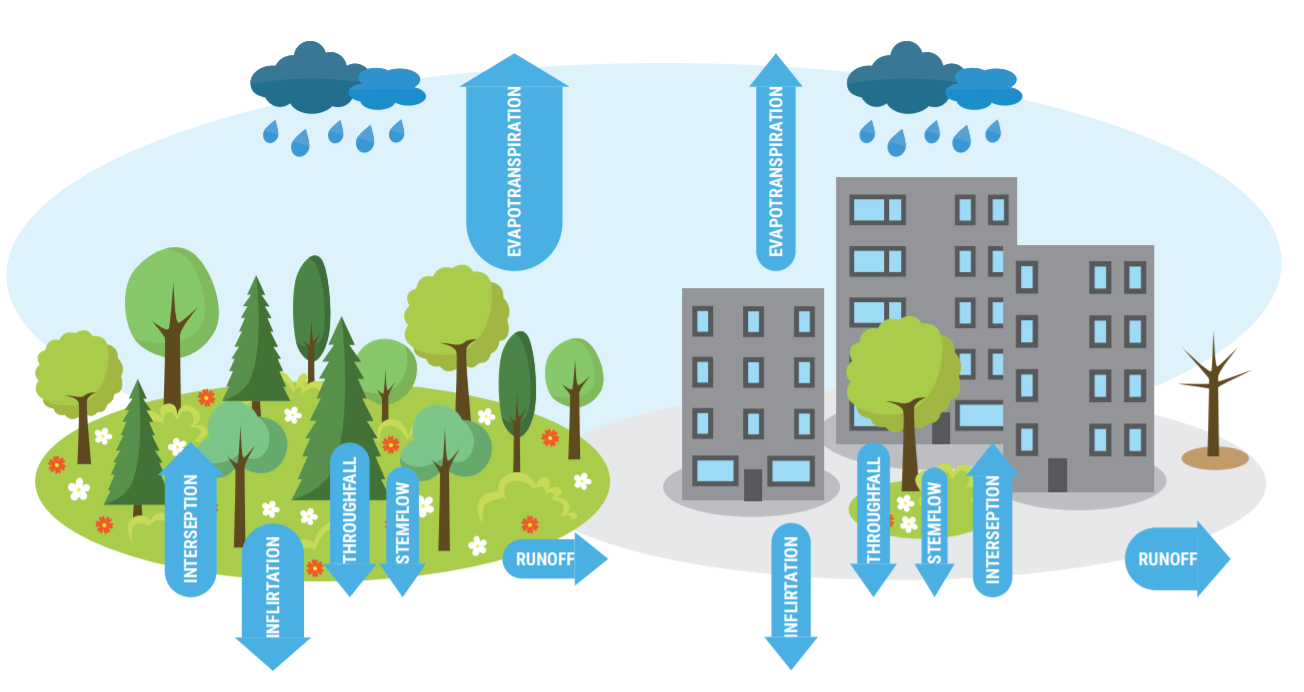
Stormwater control
Impervious surfaces are the main contributor excess stormwater runoff
The trees can help to manage the runoff by:
- Retention of precipitation water in canopies
- Water interception and uptake by roots
In situ urban trees inventory
Optimal management of urban trees requires certain tree data, e.g: location, dbh, total height, canopy size, dieback etc.
Challenges:
- Expensive
- Time consuming
- Limited access to private areas
- Lack of coherence in data collection
- Quickly outdated
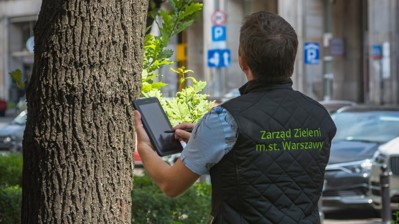
Source: portalkomunalny.pl, K. Babicki
Remote sensing data
as an alternative to in situ studies
Earth Observation
|
Sources:
Collected data:
Benefits:
|
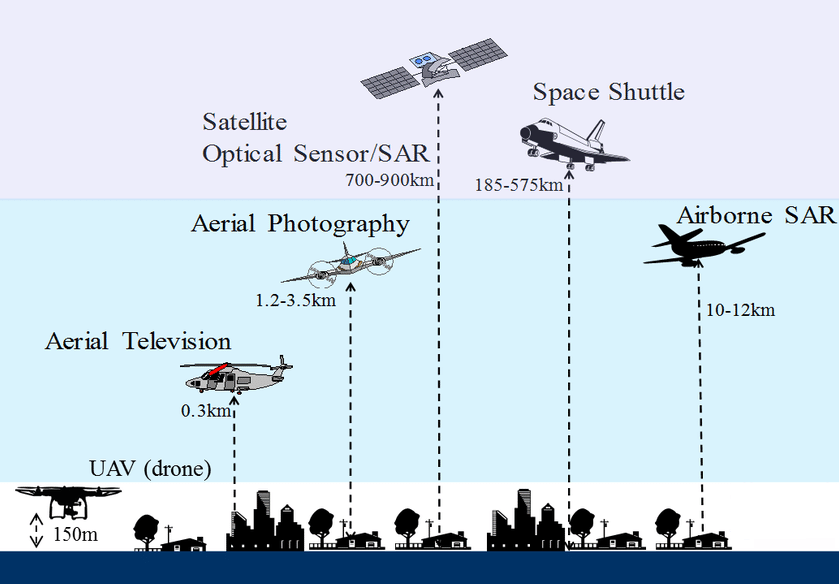
Various platforms and sensors used for remote sensing |
Advantages of using remote sensing data
- Earth observation data - unique source of information. Earth observation can provide a unique and timely source of data that is comparable across countries, regions and cities.
- It can be combined with administrative, social and economic data at multiple scales for in-depth policy analysis.
- It can help harmonise reporting on natural resources, ecosystems and environmental risks.
- Remote sensing allows to capture an image of a large area in shortintervals and is relatively cheap for the user.
- Information obtained by Earth observation is objective and can be automatically classified.
EO data - short history
- 1957 - Sputnik-1
- 1972 - Landsat-1 (NASA & USGS)
- 1986 - SPOT
- 1998 - GMES Programme
- 2014 - COPERNICUS Programme
- 2014/16 - Sentiel-1
- 2015/17 - Sentiel-2
- 2016/18 - Sentiel-3
- new missions planned
- Selected commercial satellites (spatial resolution less than 1m): IKONOS, QuickBird, WorldView GeoEye, Pleidades, KOMPSAT
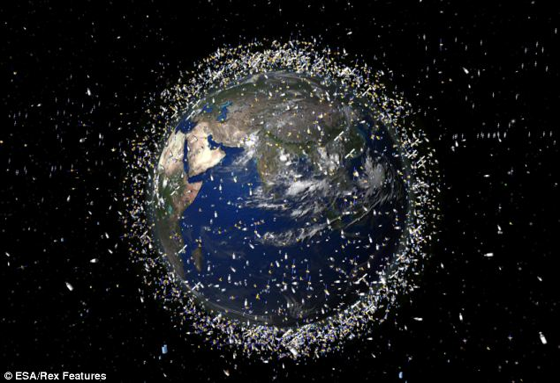
Satellites around the Earth (Source: ESA/Rex Features)
Data characteristics
|
Altitude and orbital parameters Satellite scene swath Resolution:
|
Remote sensing (Source: WhyMap) |
Spatial resolution
Spatial resolution - the size of one pixel on the ground.
Spatial resolution is a measure of the smallest object that can be resolved by the sensor, or the ground area imaged for the instantaneous field of view (IFOV) of the sensor, or the linear dimension on the ground represented by each pixel. (Advanced Remote Sensing, 2012)
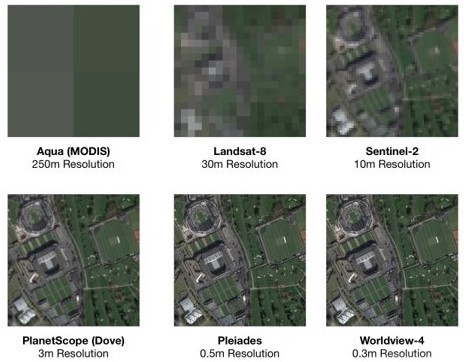
(Source: Radiant Earth Foundation)
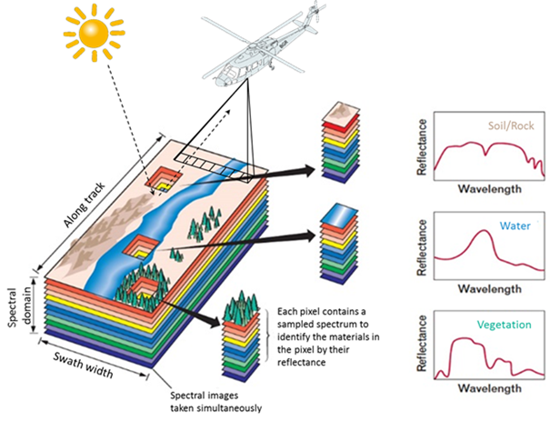
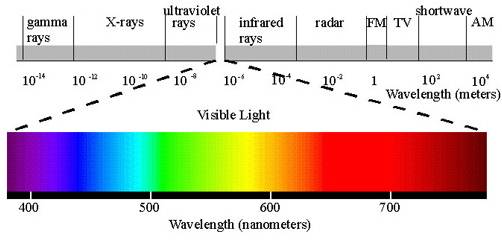
Spectral resolution
Spectral resolution - refers to the spectral bandwidth and the number of bands.
The finer spectral resolution, the narrower the wavelength range for the particular band.
(Source: ResearchGate.net)
Radiometric resolution
Radiometric resolution - the sensitivity to the magnitude of the electromagnetic energy. It describes the actual information content in an image, expressed in units of bits.
The finer the radiometric resolution, the more sensitive it is to detect small differences in reflected or emitted energy.
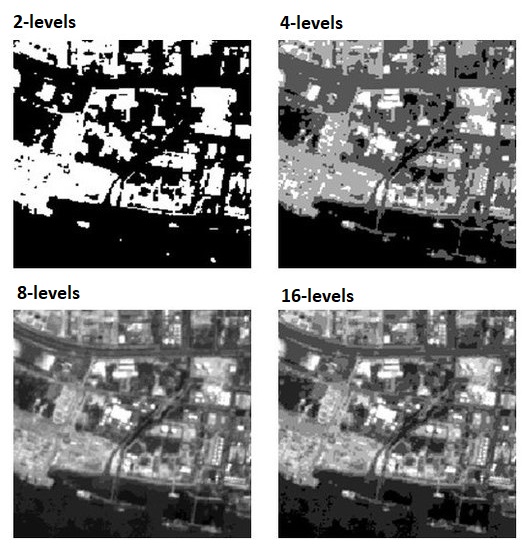
(Source: Research Gate)
Temporal resolution
Temporal resolution - frequency at which the same place is observed
(revisit capability).
It is particularly important for change mapping.
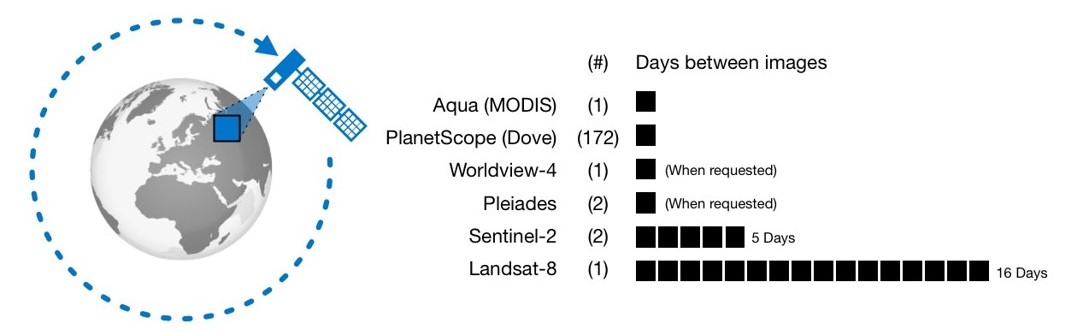
(Source: Radiant Earth Foundation)
EO Data as open data
Examples of EO browsers:
- Sentinel-Hub: https://apps.sentinel-hub.com/eo-browser/
- Sentinel-Playground: https://apps.sentinel-hub.com/sentinel-playground/
- Copernicus Open Access Hub (ESA): https://scihub.copernicus.eu/dhus/#/home
- Creodias: https://browser.creodias.eu/
- Earthdata Search (NASA): https://search.earthdata.nasa.gov/search
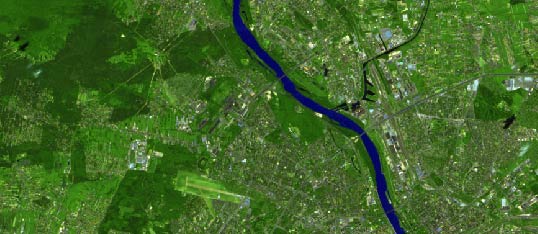
EO browser - open data
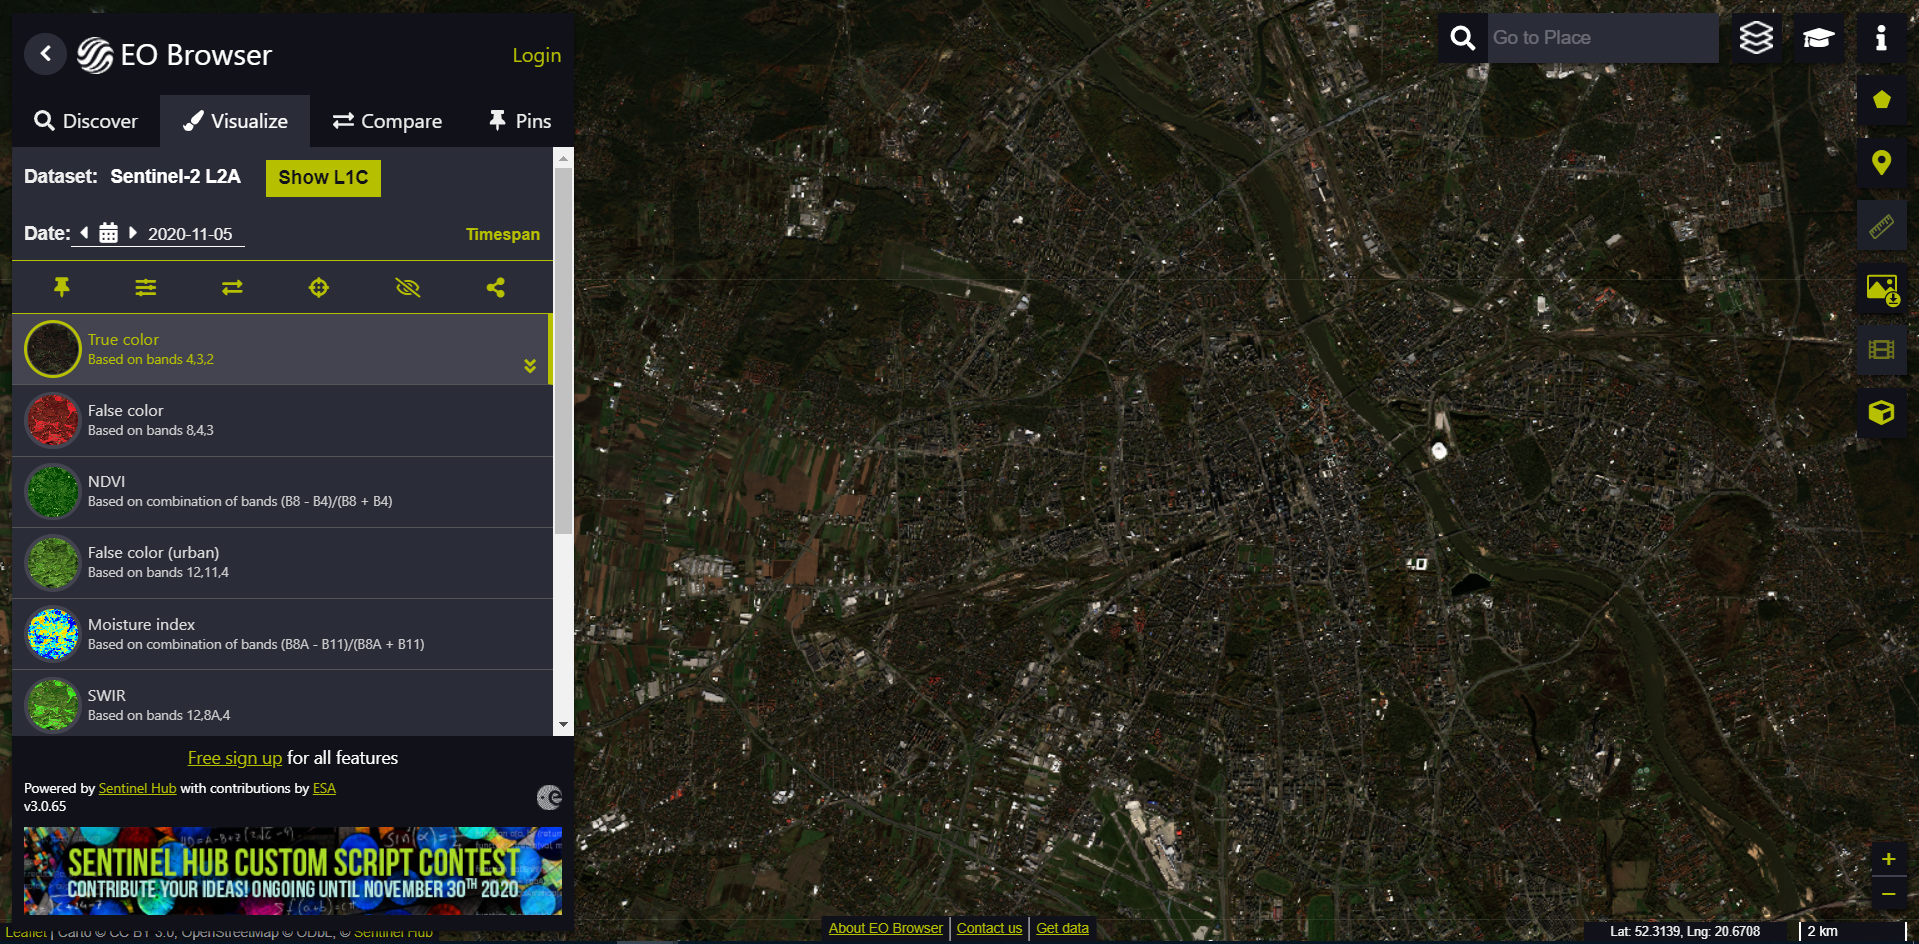
Sentinel-2 RGB satellite imagery (Source: EO Browser Sentinel-Hub)
EO browser - open data
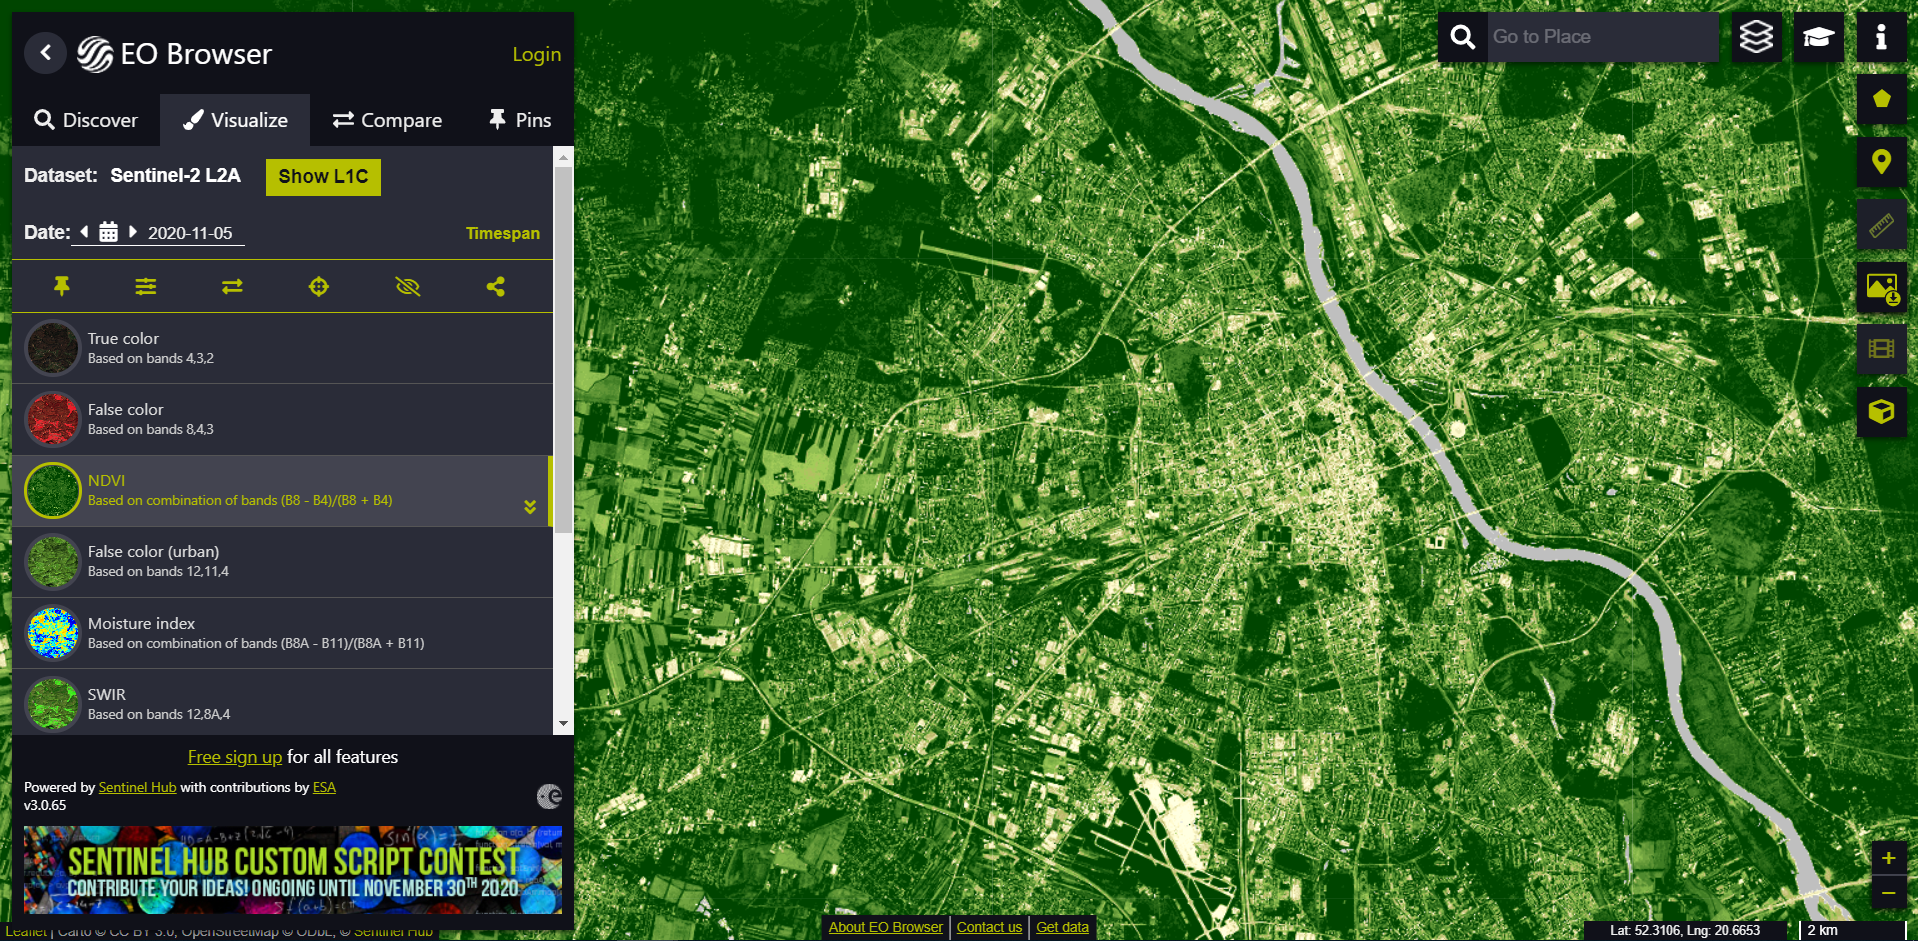
Sentinel-2 NDVI image (Source: EO Browser Sentinel-Hub)
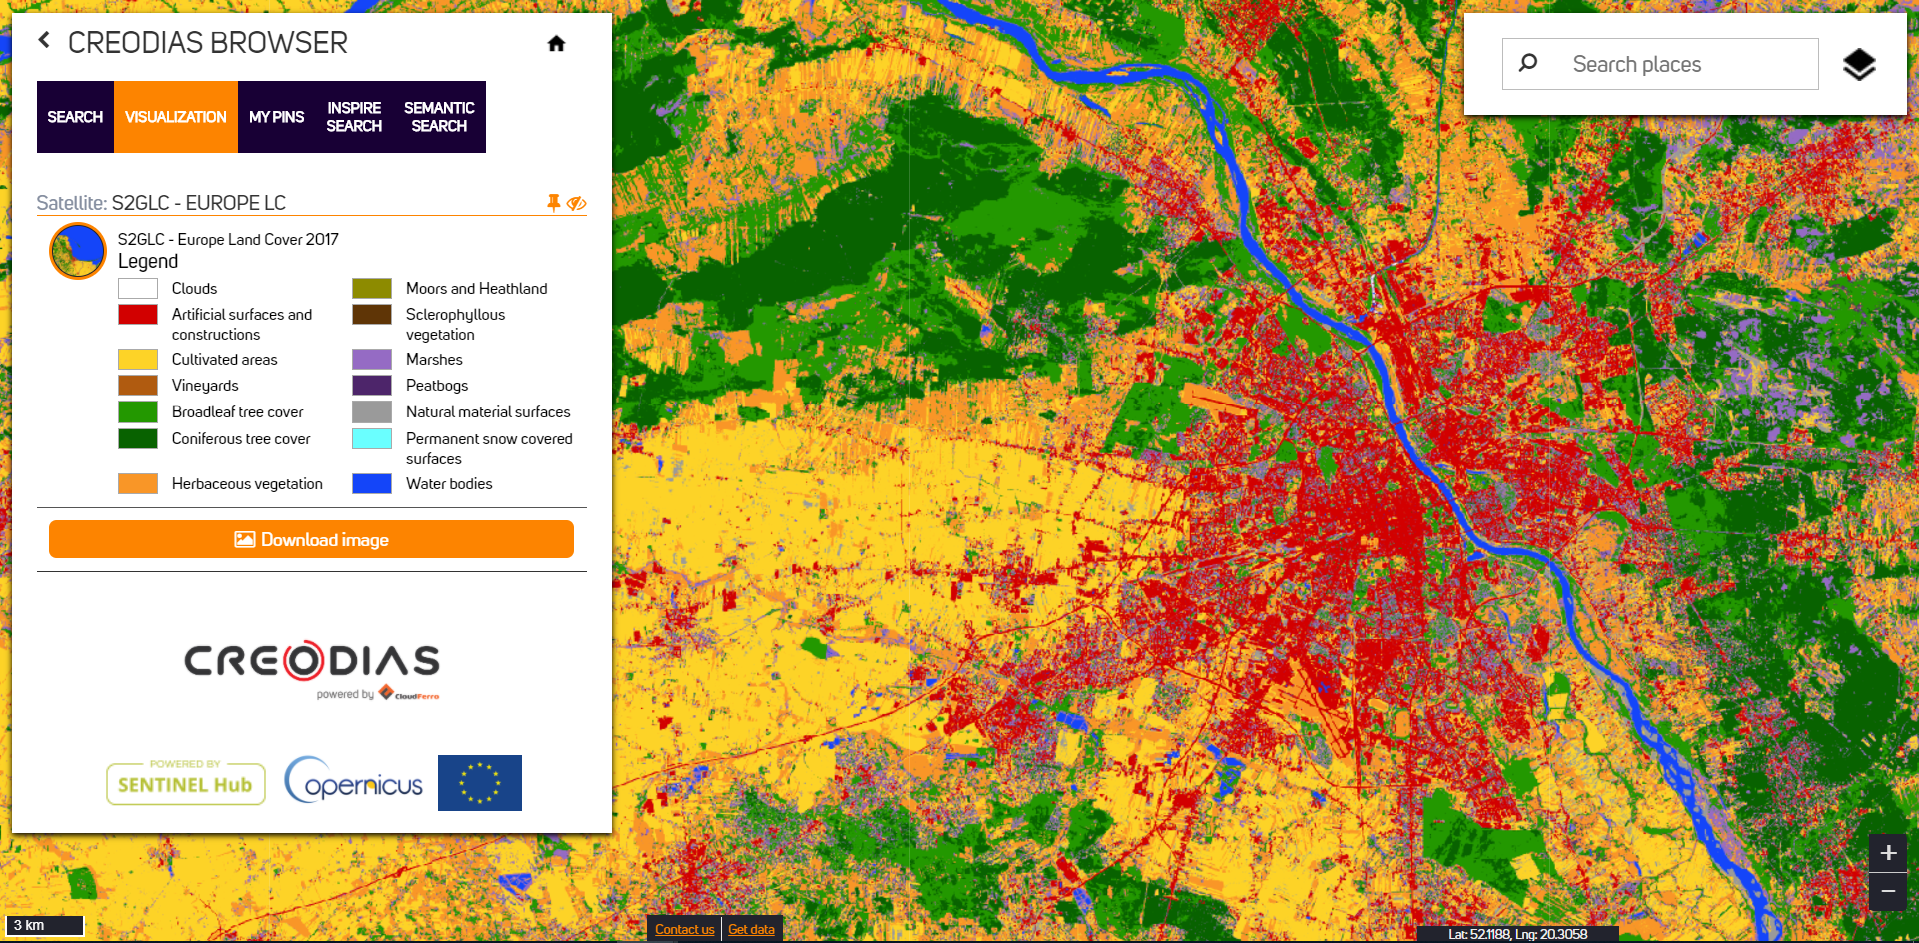
Sentinel-2 Global Land Cover (Source: Creodias Browser)
Sentinel-2
- Launch: 23 June 2015 (Sentinel-2A) and 7 March 2017 (Sentinel-2B)
- Orbital height: 799 km
- Instrument: the Multi-Spectral Instrument (MSI)
- Spatial resolution: 10 m / 20 m / 60 m
- Spectral resolution: 13 spectral bands (VI/Red Edge/NIR/SWIR)
- Temporal resolution: 10 days (1 satellites) 5 days (2 satellites)
- Swath width: 290 km
- Main applications: agriculture, land ecosystems monitoring, forests management, inland and coastal water quality monitoring, disasters mapping, civil security
- Copernicus Services:

Urban Atlas
Spatial extent: EU27, EFTA, West Balkans, Turkey, UK
Classification: 17 urban classes with MMU 0.25ha 10 rural classes with MMU 1ha, MMW 10m
Products:
→ Land Cover/Land Use - edition 2018
→ 2012-2018 change product
→ Revised 2012 edition of Urban Atlas
→ Street Tree Layer (STL)
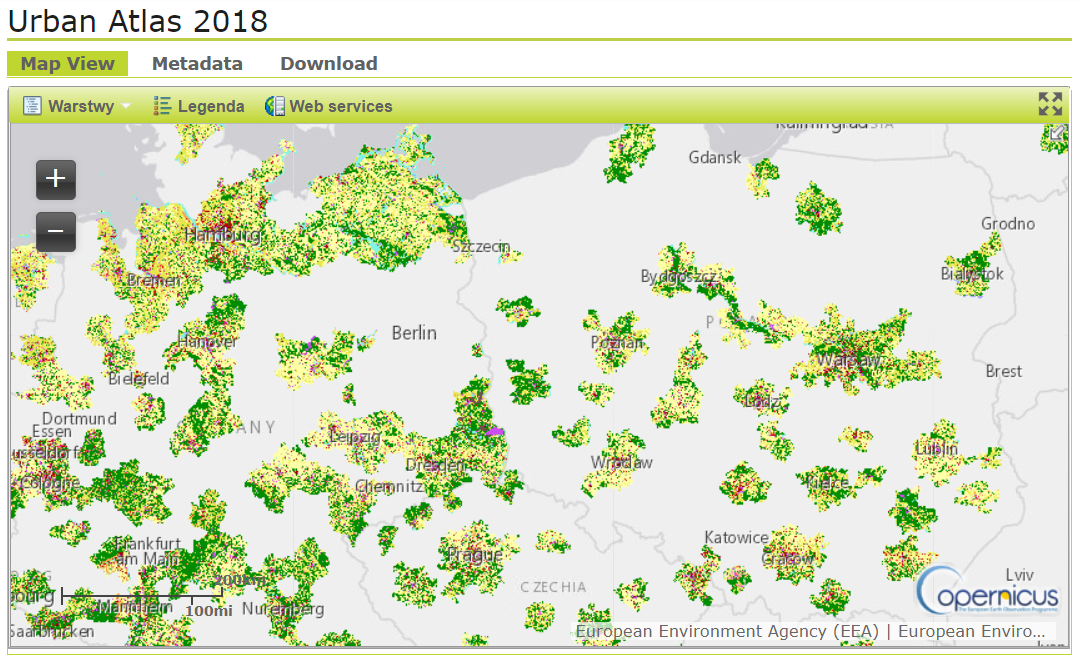
Extent of Urban Atlas 2018 (Source: Land Monitoring Service)
Street Tree Layer
The Street Tree Layer (STL) is a separate layer from the Urban Atlas 2012 LU/LC layer produced within the level 1 urban mask.
It includes contiguous rows or a patches of trees covering 500 m² or more and with a minimum width of 10 m over "Artificial surfaces" (nomenclature class 1) inside FUA (i.e. rows of trees along the road network outside urban areas or forest adjacent to urban areas should not be included).
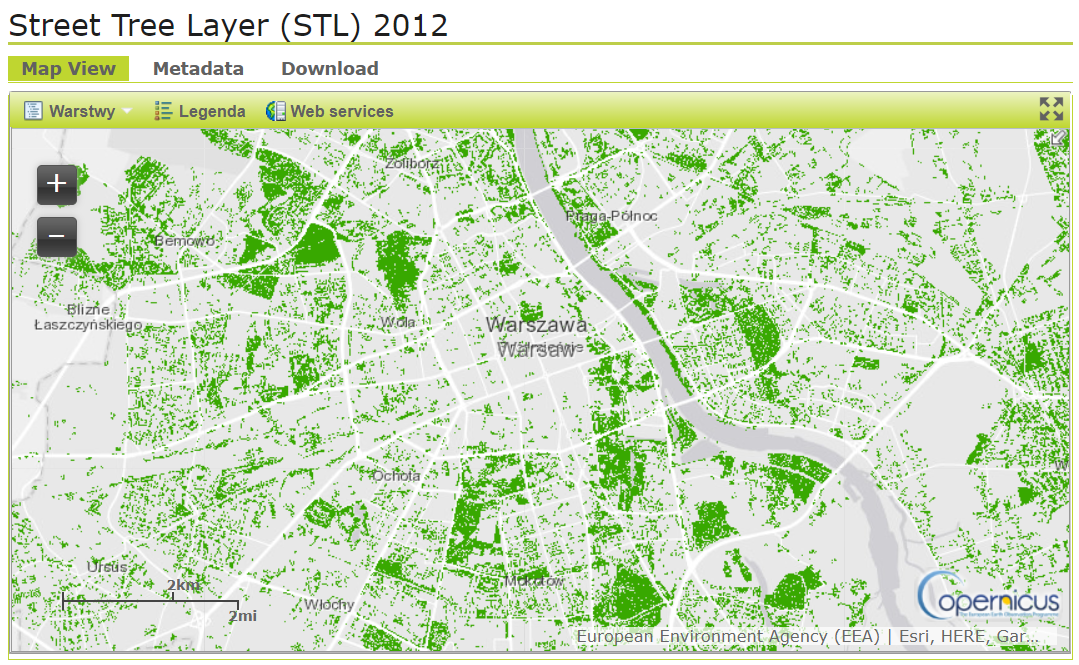
Street Tree Layer 2012 (Source: Land Monitoring Service)
High Resolution Layers (HRL)
Pan-European HRL provide information on specific land cover characteristics, and are complementary to land cover/land use mapping such as in the CORINE land cover (CLC) datasets. The main sources of data are the Sentinel satellites (in particular Sentinel-2 and Sentinel-1).
Five themes identified so far:
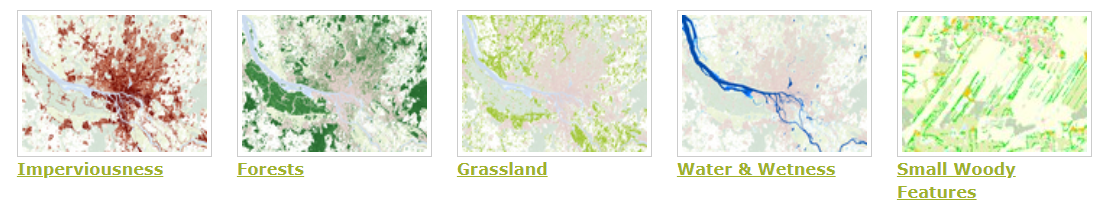
High resolution layers (Source: Land Monitoring Service)
Applications - example
Use of satellite images for development of the climate adaptation strategy, based on the results of
LIFE_ADAPTCITY_PL project
Preparation of a strategy of adaptation to climate change with use of city climate mapping and public participation
and the publication "Warsaw from space".
Applications - example (1)
Land cover change detection:
- increase/decrease of green areas in the city
- determination of change trend
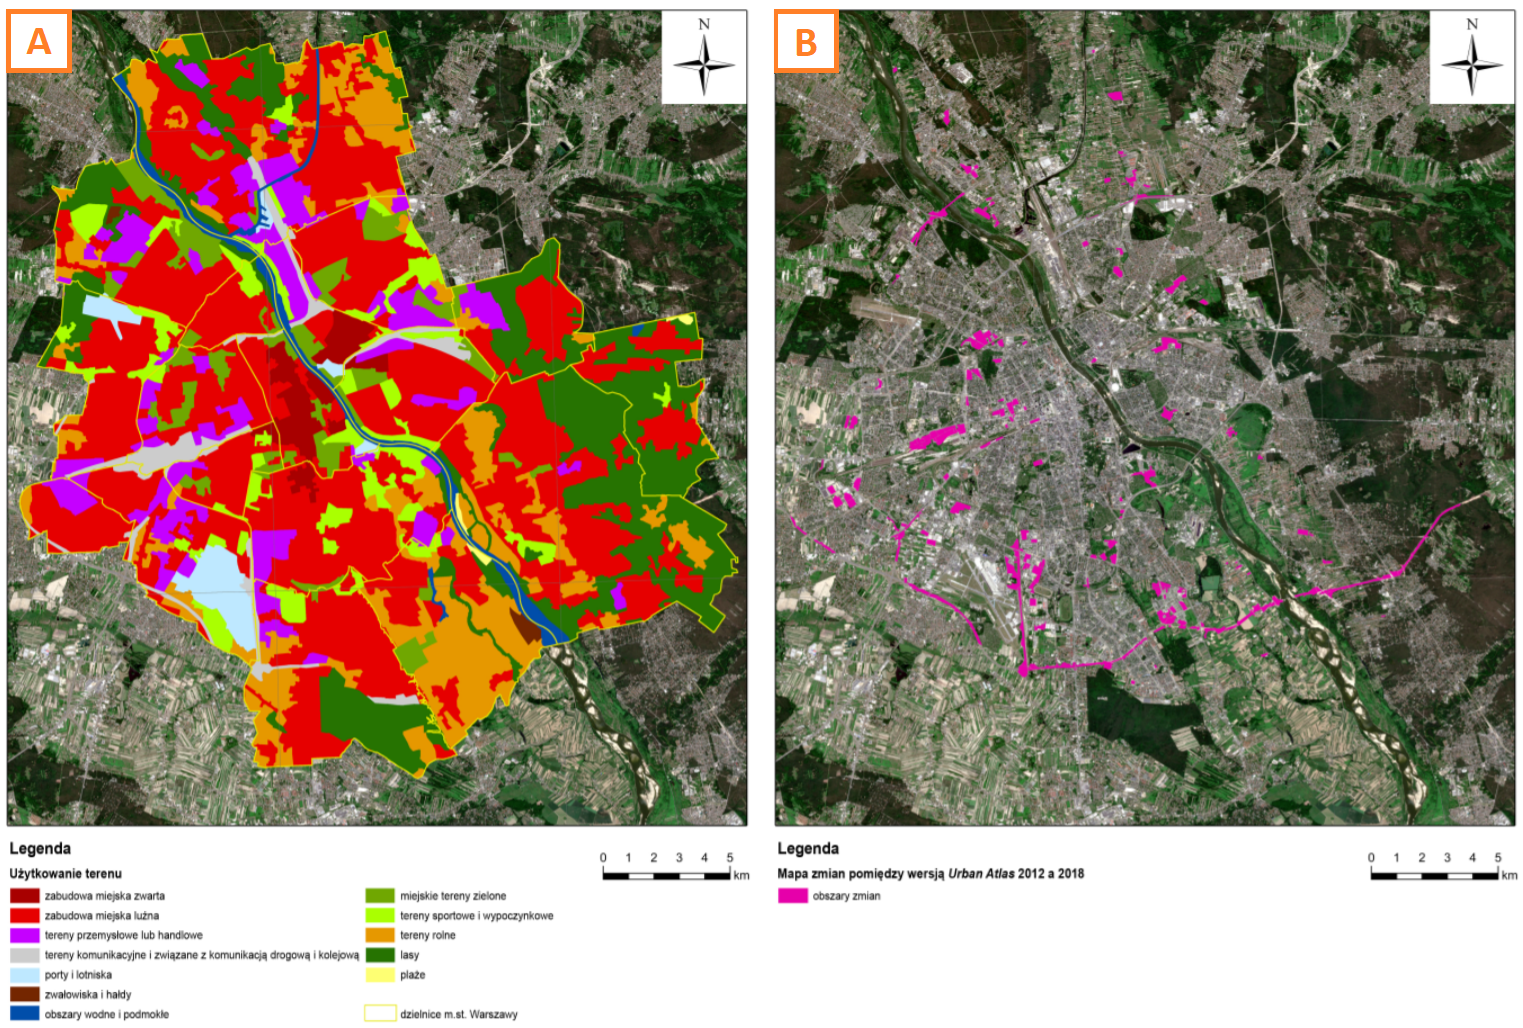
(A) Land cover in Warsaw - Urban Atlas 2018, (B) Land cover changes in Warsaw between 2012 and 2018 (Source: Publication Warszawa z kosmosu)
Applications - example (2)
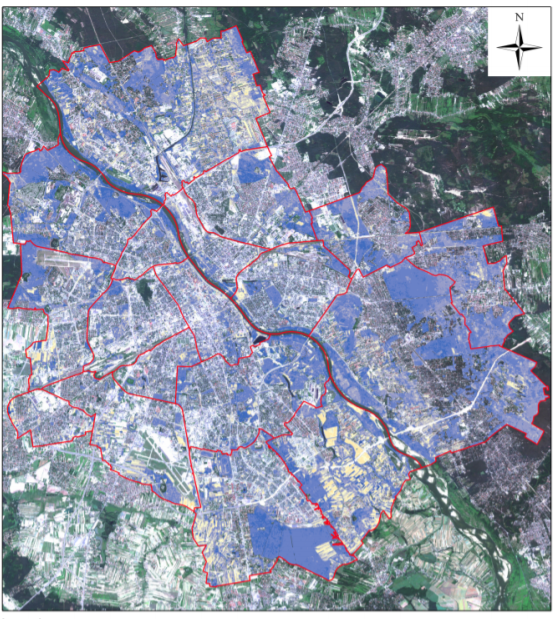
Impermeable (artificial) vs. permeable (biologically functional) surfaces
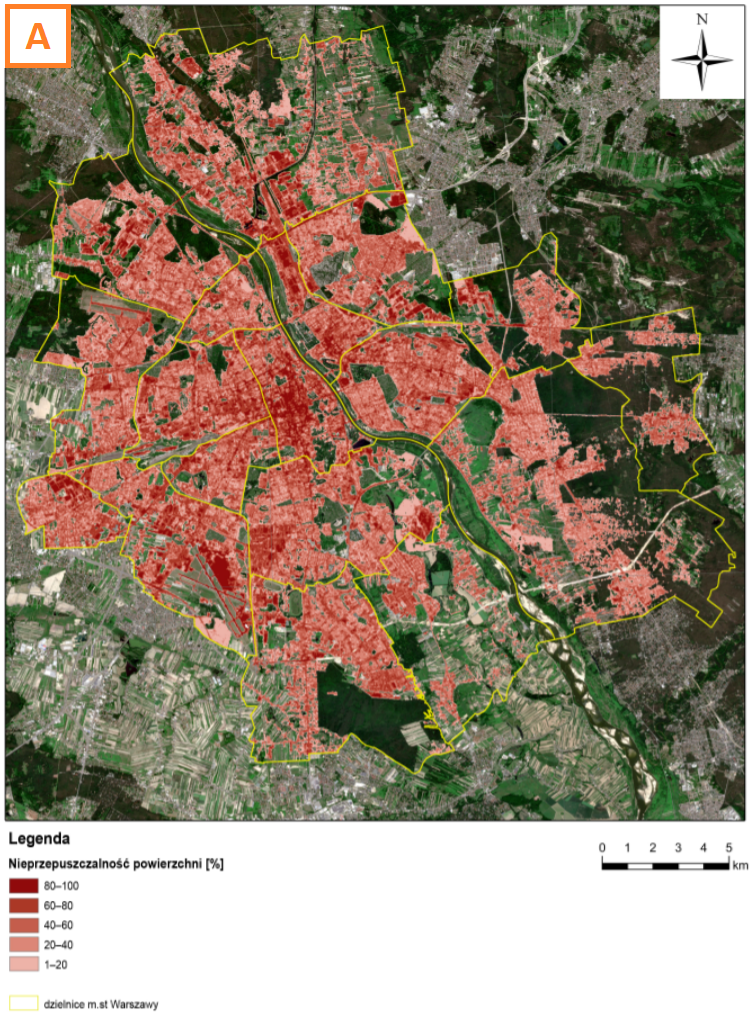
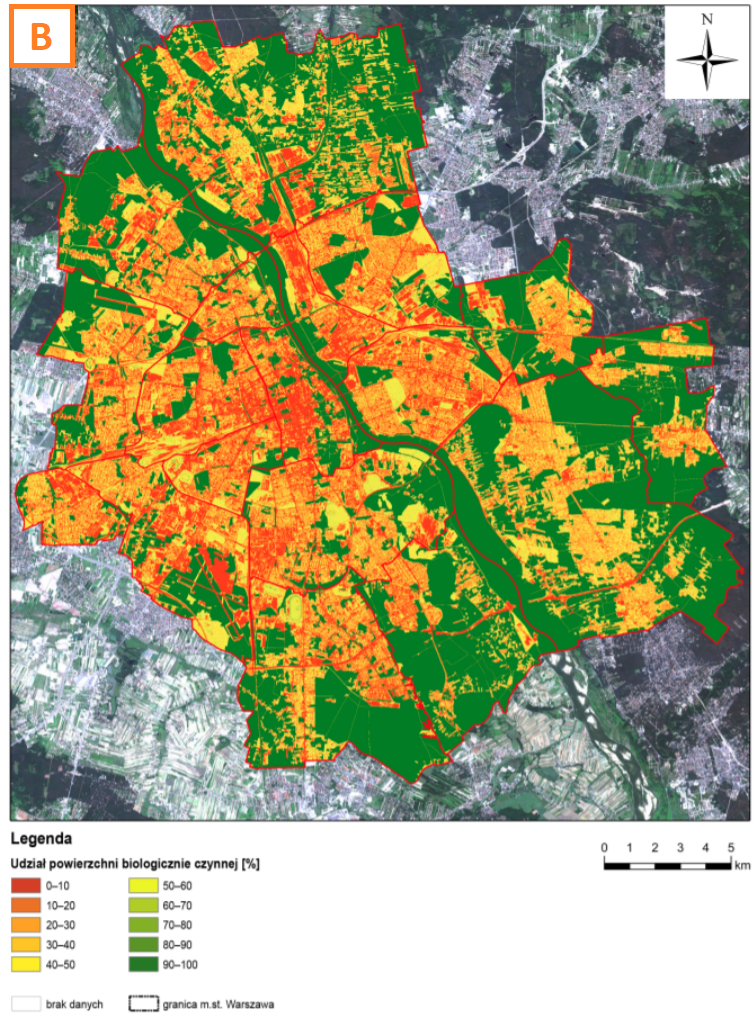
(A) Surface impermeability in 2014, (B) Percentage of biologically functional surface in 2018 (Source: Publication Warszawa z kosmosu)
Applications - example (3)
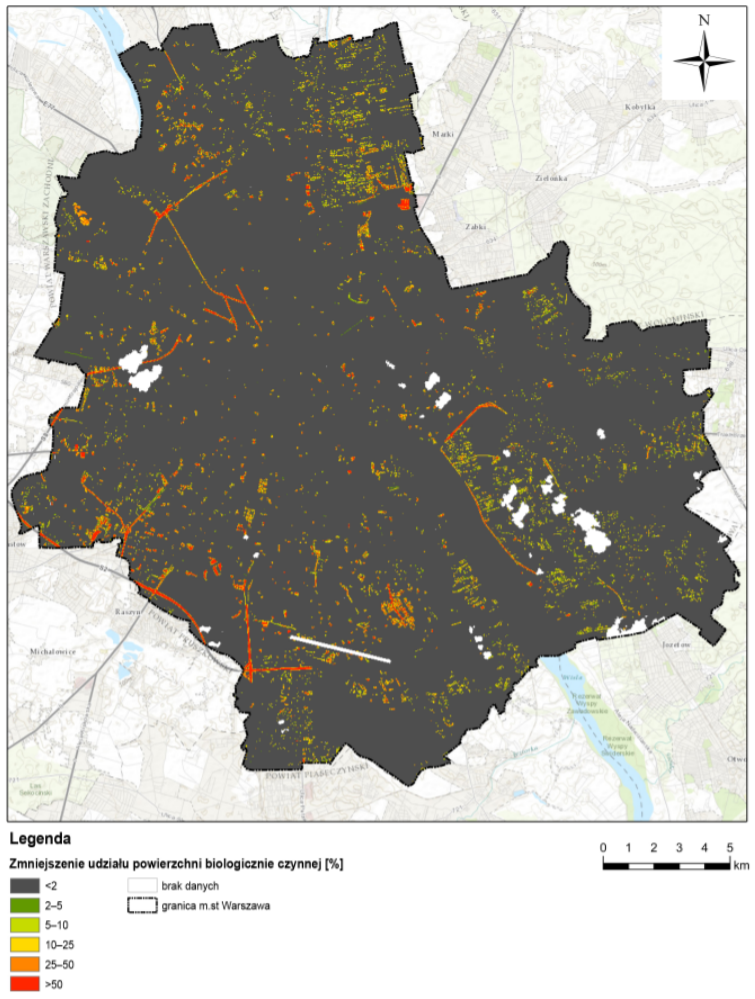
Change of biologically functional surface - comparison of the situation in 2006 and 2014 (Source: Publication Warszawa z kosmosu)
Change detection:
increase of impermeable surfaces
Biologically functional surface in Fort Służew in 2016 and 2018 (Source: Publication Warszawa z kosmosu)
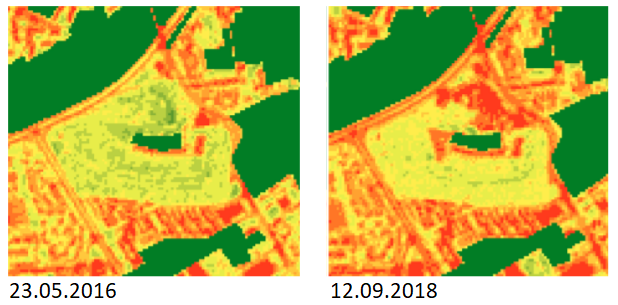
Applications - example (4)
NDVI - Normalized Difference Vegetation Index
Effective for quantifying green vegetation. Positively correlated with vegetation greenness.
NDVI = (NIR – Red) / (NIR + R)
NDVI range value is -1 to 1
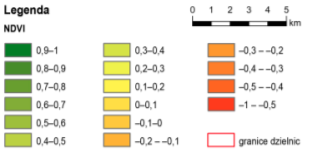
NDVI value on 12.09.2018 (Source: Publication Warszawa z kosmosu)
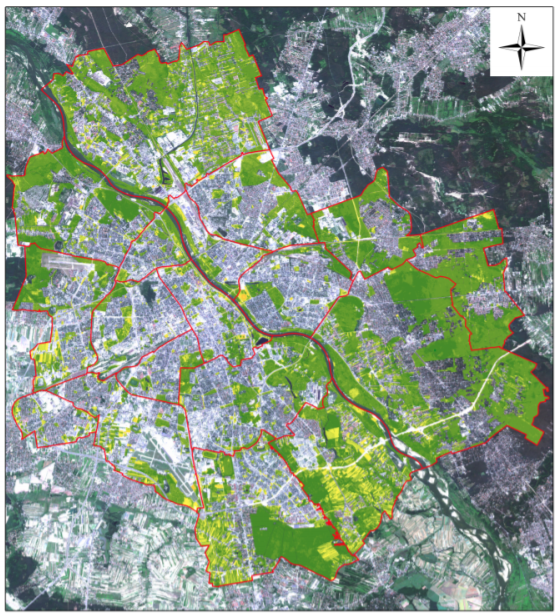
Applications - example (5)
- NDII (Normalized Difference Infrared Index)
- MSI (Moisture Stress Index)
- NDWI (Normalized Difference Water Index)
- SAVI (Soil Adjusted Vegetation Index)
- EVI (Enhanced Vegetation Index)
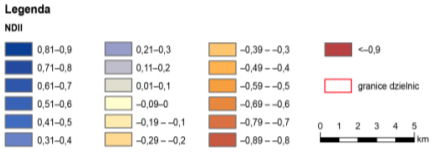
NDII value on 31.08.2017 (Source: Publication Warszawa z kosmosu)
Applications - example (6)
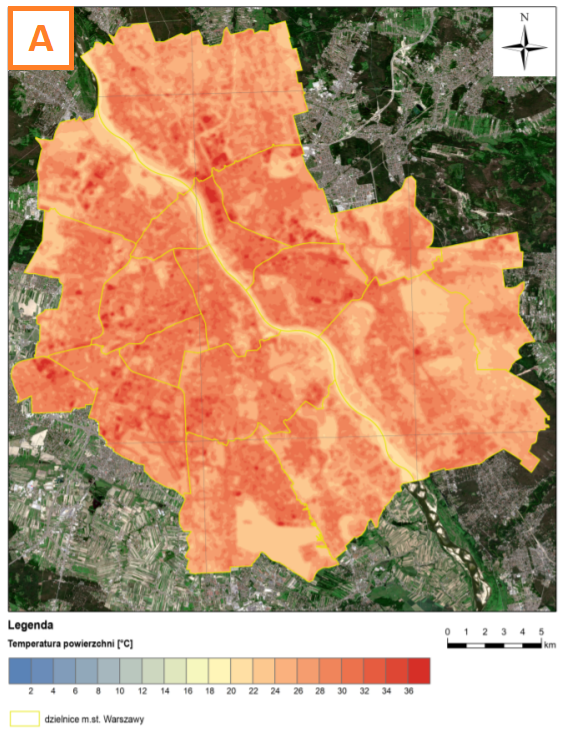
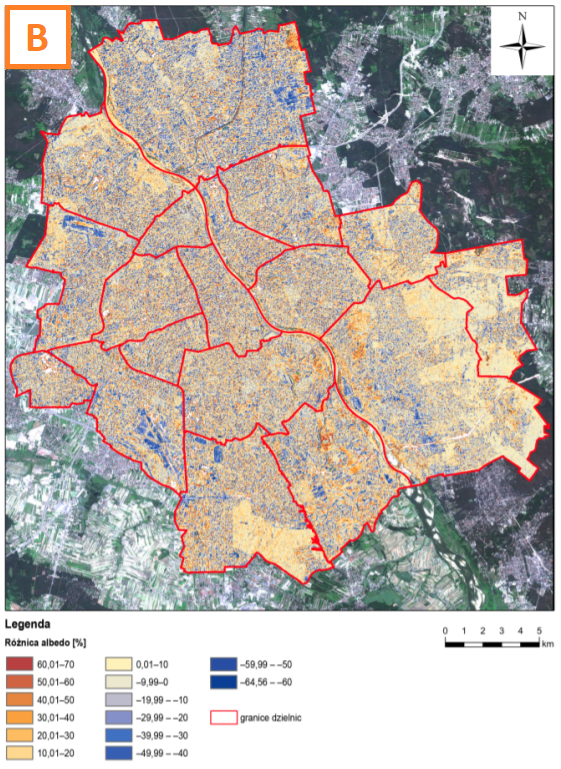
(A) Surface temperature on 20.06.2013, (B) Albedo gaps (%) 8.09.2013 - 12.09.2018 (Source: Publication Warszawa z kosmosu)
Applications and limitations
Applications:
- Identification and classification of different types of green areas
- Estimation of green urban areas
- Proximity of green urban areas
- Change detection
- Vegetation and water indices
Limitations:
- Lack of attributes for the single tree (taxon, height, ...)
- Impossible single tree health assessment
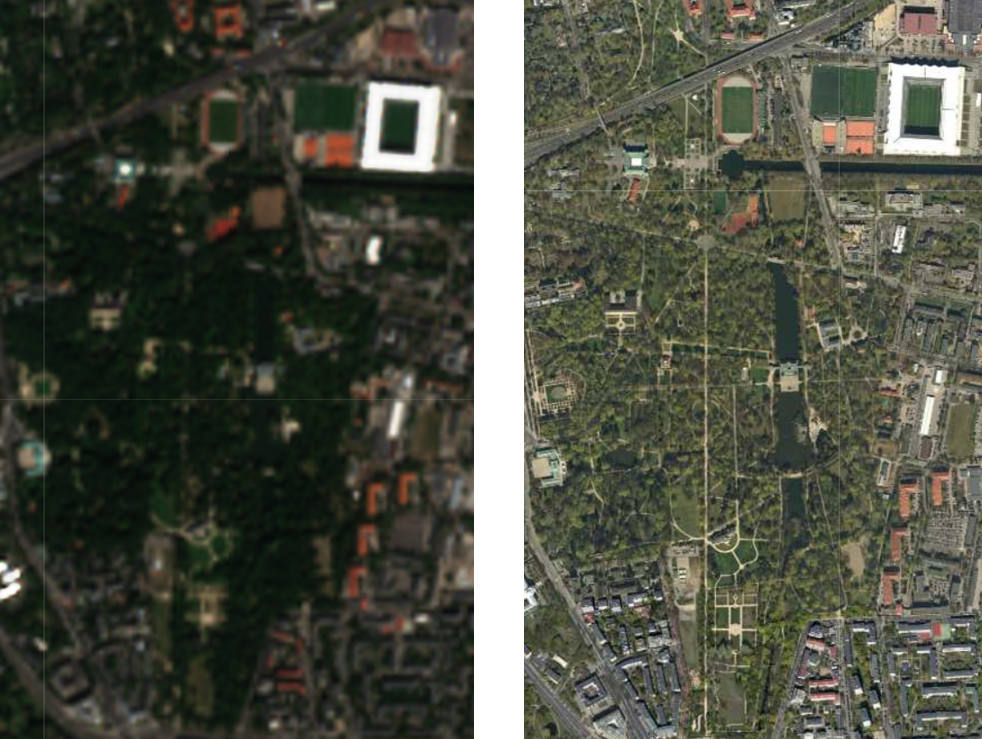
Comparison of images with different spatial resolution
- 10 m (left: Sentinel-2) and 1 m (right: orthophoto)
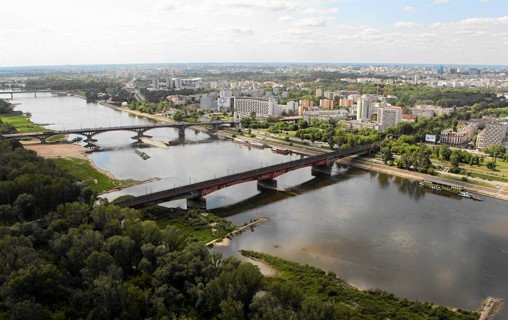
Warsaw case study
- the Tree Crown Map
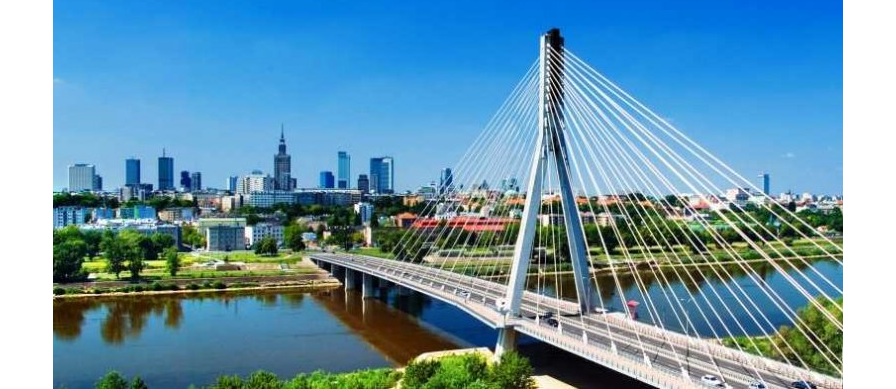
Urban greenery management in Warsaw
Actions undertaken by city authorities:
- Declaration of Tree Rights
- Urban Greening Guidelines
- Tree Crown Map
- Tree Trunks Location Map
- Tree Risk Management
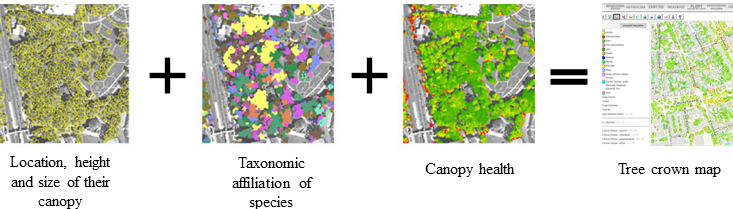
Tree Crown Map - content
Tree Crown Map include the following types of data about trees:
- Location, height and size of their canopy
- Taxonomic affiliation of species
- Canopy health
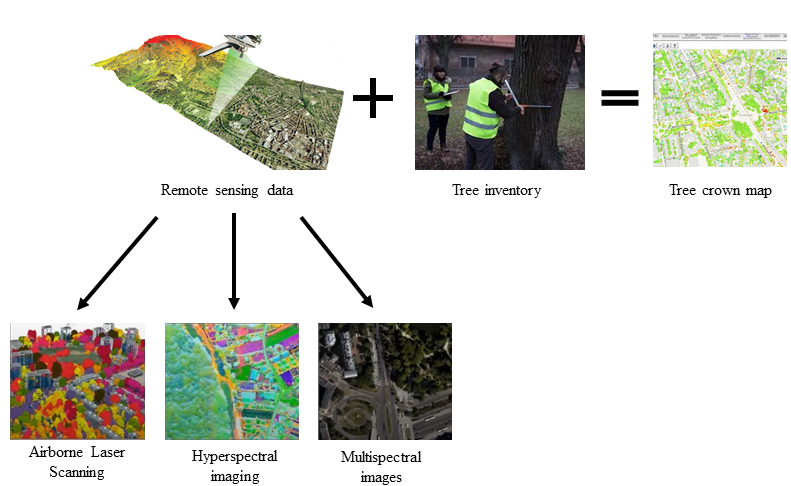
Tree Crown Map - methods
Methods of developing the Tree Crown Map (TCM) included:
- It was developed with the use of aerial remote sensing
- The analyses included three types of remote sensing data and data obtained from tree inventory
- Machine learning was used in the analyses
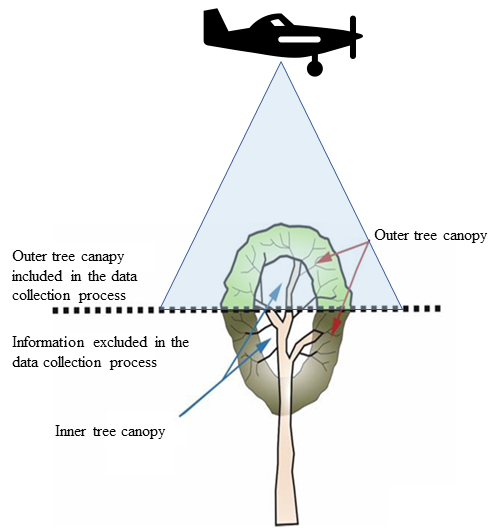
Tree Crown Map - what is included?
Trees included:
- 23606 trees under inventory
- 8 mln of trees investigated (out of 9 mln)
Criteria:
- Canopy is visible from aerial perspective
- Canopy area > 7m2
- Tree height > 3m
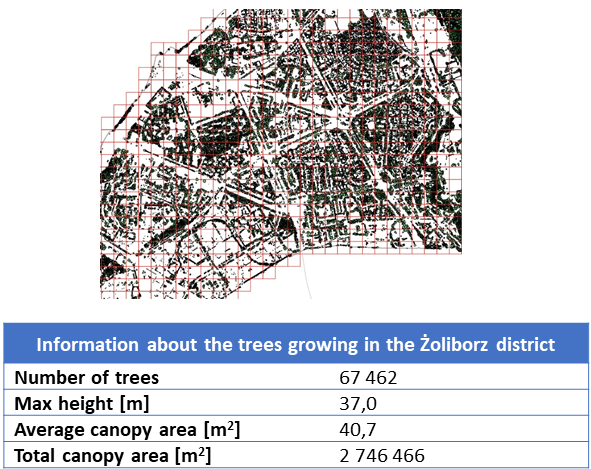
I. "Location, height and size" data type
Information gained from the data:
- Number of trees
- Canopy size
- Total canopy area
Potential use:
- Urban greenery per 1 inhabitant/ha of land
- Most precious trees
- Supplementary plantings
- New investment planning
- Recognition of age/size structure of trees
- Adaptation to climate change
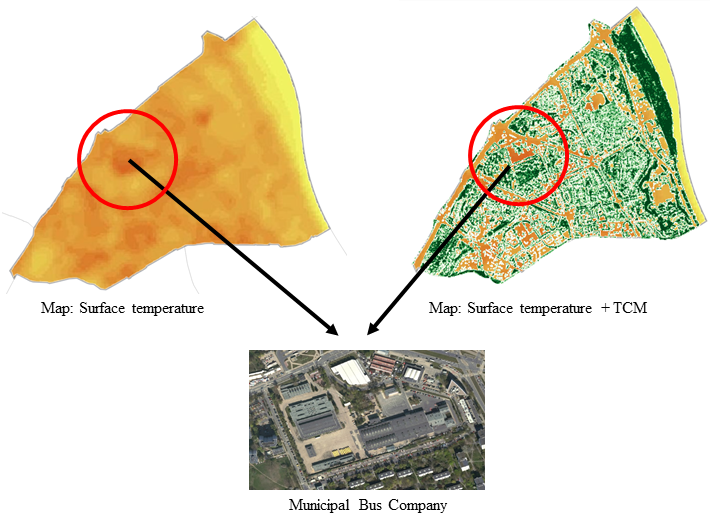
Adaptation to climate change - local climate control
Example of analysis:
- Selection of areas without tree canopies
- Including them as a priority for reclamation
- Planting trees and/or changing surfaces for high albedo surfaces
Adaptation to climate change - energy conservation
Example of analysis:
- Selection of buildings where energy consumption is affected by trees
- Improving the optimal performance of new tree plantings

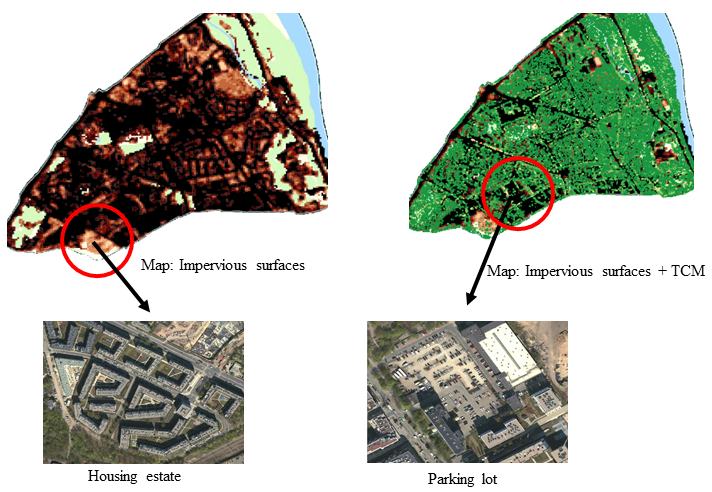
Adaptation to climate change - stormwater control
Example of analysis:
- Identification of areas with impervious surfaces and lack of trees
- Including them as a priority for reclamation
- Planting trees and/or changing surfaces for pervious surfaces
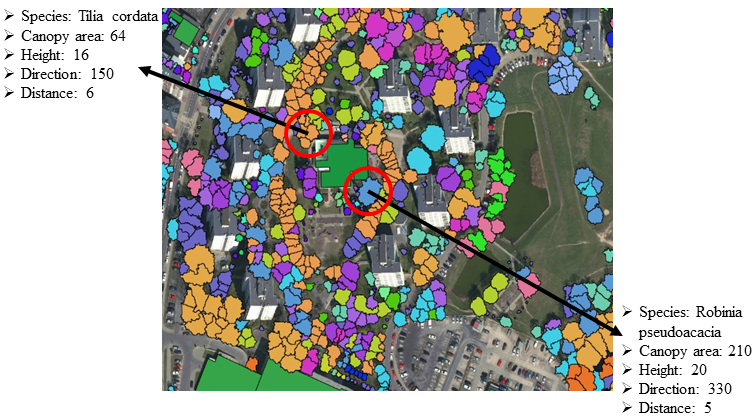
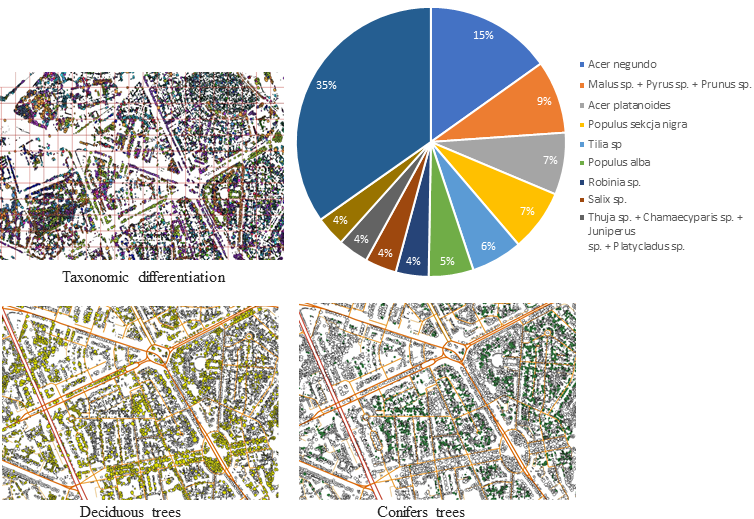
II. "Taxonomic affiliation" data type
Information gained from the data:
- Taxonomic differentiation
- Spatial distribution of taxa
Potential use:
- Analysis of taxonomic differentiation of a specific area
- Planning new planting
- Recognition of the age/size structure of trees of a given species
- Adaptation to climate change
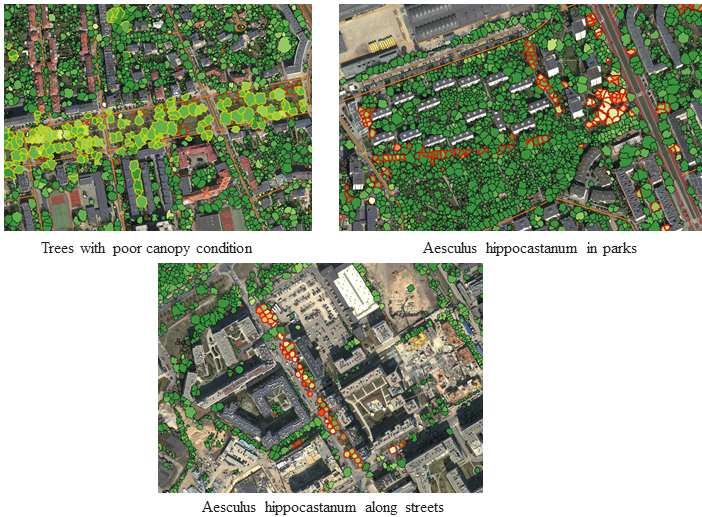
III. "Canopy health" data type
Information gained from the data:
- Differentiation of canopy condition
- Diversity in the health of selected tree species
Potential use:
- Identification of dead and dying trees
- Identification of disease/victimites sites
- Help in identifying the sources of poor tree condition
- Adaptation to climate change
Learn more...
- About remote sensing - see presentation
- About Sentinel-2 data and vegetation indices - see presentation
- About EO data sources - see presentation
- About Copernicus services - see website
- About Warsaw's Tree Crown Map - see website
Reference list:
Szymalski W., Kassenberg A., Świerkula E., Warszawa z kosmosu, Fundacja na rzecz Ekorozwoju, Warszawa 2019
Existing EO4GEO training materials: Introduction to Remote Sensing, Sentinel-2 data and vegetation indices and EO Data sources
Websites:
Thank you!
More training material available at:
http://www.eo4geo.eu/training-material-catalogue/
More training actions available at:
http://www.eo4geo.eu/training-actions/

|
www.eo4geo.eu |

|
@EO4GEOtalks |